Aug' 21
The IUP Journal of Marketing Management
Archives
A Comparative Study of Perceived Service Quality of Cab Aggregators and Traditional Public Transport Services Using SERVPERF Model in National Capital Region
Garima Arora
Research Scholar, IMSAR, Maharshi Dayanand University, Rohtak, Haryana, India; and is the corresponding author. E-mail: garimaarora9992@yahoo.in
Ashok Kumar
Assistant Professor, IMSAR, Maharshi Dayanand University, Rohtak, Haryana, India.
E-mail: ashok.verma1@yahoo.in
Tremendous development has been taking place across all the sectors in India and transportation industry has been no exception. The entry of radio cabs in the market in the early 2000s brought about a huge change in the largely unorganized taxi market of the country. Nevertheless, all categories of transport service providers need to examine the perceived service quality to better cater to passengers' needs. In this context, the current study aims to make a comparative analysis of perceived service quality of cab aggregators and traditional public transportation services in the National Capital Region (NCR) using SERVPERF (Service Performance) model. Primary data has been collected using well-structured standardized questionnaires. By using paired t-test, it has been concluded that there is a significant difference in perceived service quality of cab aggregators and traditional public transport services with respect to dimensions relating to tangibility, responsiveness, assurance and empathy. However, with regard to the reliability dimension, no significant differences have been observed in the service quality, pointing out an important takeaway for the cab aggregator industry.
Introduction
Service quality implies how the customer essentially perceives the overall experience of the service (Johns, 1992). The famous Gap model proposed by Parasuraman et al. (1988) proposed the five gaps which can be used to gauge the level of service quality and it also lays the foundation for further improvement of perceived service quality. The said model further identified five dimensions, namely, reliability, assurance, tangibility, empathy and responsiveness along which the service quality can be assessed. The differences between expectation and experience of the customer on these dimensions reflect the customers' perception of service quality. In case of the perceived service being less than the expectation of the service, the customers become dissatisfied. However, when perception exceeds expectation, it results in satisfied customers (Andreassen, 1995).
Public transport facilitates transportation to the masses, catering to their day-to-day needs. It encompasses rail, boats, buses, trolleys and subways (Tran and Kleiner, 2005). Several public transportation services are catered to by the government keeping the welfare of the general public in mind. However, with passage of time, the service quality of public transportation gradually deteriorated and people are left with no option but to stick to the service (Andreassen, 1994). The specific dimensions pertaining to service quality of public transportation have been identified as "better experience management, adoption of corporate style of functioning, benchmarking activities, competitive work based environment, optimization and better planning of organizational resources and more focus on service quality output generation" (Hood, 1995). The lacunae in the public transportation system was one of the major factors which led to the arrival of the organized taxi market in the country in the year 2000. Over the years, the business model transformed and ride sharing came into the scenario. The cab aggregation industry has been growing by leaps and bounds. This can be attributed to several factors like increase in the number of smartphone users, better Internet access, generous investment in the industry and rising income levels.1
In order to get an overall picture of the quality of service of the transportation industry, it is pertinent to study the traditional public transport and the evolving cab aggregation industry together. This study shall be very fruitful since there has been almost negligible research aimed at making a comprehensive analysis of cab aggregators and traditional public transportation services. An attempt has been made to standardize the service quality measurement in both of these categories across five dimensions (tangibility, reliability, responsiveness, assurance and empathy) by taking into consideration the respective items pertaining to each service dimension so as to facilitate meaningful comparison.
Literature Review
The area of service quality has been a well-researched area. Several studies have been made to capture the multidimensional nature of the construct. Various models have been proposed to examine the service quality across industries (Parasuraman et al., 1985; Cronin and Taylor, 1992; Brady and Cronin, 2001; and Parasuraman et al., 2005). One of the most popular models is the SERVQUAL model proposed by Parasuraman et al. (1988) which conceptualized five broad dimensions, namely, "reliability, assurance, tangibility, empathy and responsiveness" based on which the quality of service across different service industries can be measured. It is based on disconfirmation paradigm which illustrates how "customer's expectations are confirmed or disconfirmed by his actual service experience". The proposed model has been further employed and reinforced in several industries for assessing the service quality (Siddiqui and Sharma, 2010).
After the assessment of this construct, effective steps can be taken to make improvement so as to help the business in realizing its competitive advantage (Hensel, 1990; and Berry and Parasuraman, 1997). Subsequently, it has also been observed that by delivering the services beyond the customer's expectations, the customer is delighted (Rust and Oliver, 2002). In addition to this, higher perceived service quality leads to better customer satisfaction which ultimately results in better financial returns (Zeithaml et al., 1996; and Liu et al., 2000). Hence, businesses intend to achieve high perceived service quality and technical efficiency (Gronroos and Ojasalo, 2004). Also, since the customer is educated and intends to maximize his/her satisfaction, it is indispensable for businesses to cater to his/her requirements in the best possible way (Khurana, 2014).
SERVQUAL model has been further altered to enable better assessment of the perceived service quality across industries (Parasuraman et al., 1991). Subsequently, the expectation component was severely criticized upon and it was concurred that only perceptual component significantly influences the service quality (Boulding et al., 1993;
Holdford and Patker, 2003; and Abdullah, 2006). SERVPERF (Service Performance) is a "performance based measure of service quality which models customers' actual perception to access service quality in a better way" (Cronin and Taylor, 1992). In addition to this, E-S-QUAL (electronic service quality) (Parasuraman et al., 2005) is another modified version of SERVQUAL model to capture the construct of service quality as per the specific sector. E-S-QUAL measures "the service quality of the websites on which customers shop".
In addition to this, the assessment of service quality remains pertinent in the
m-commerce setup too (Huang et al., 2015). MS-QUAL was developed to provide a scale on which the mobile service quality could be measured for both physical and virtual goods (Huang et al., 2015). It proposed nine dimensions which are "efficiency, system availability, content, privacy, fulfillment, responsiveness, compensation, contact and billing" using both Exploratory Factor Analysis and Confirmatory Factor Analysis.
However, another study has proposed different dimensions, namely, interaction quality, environment quality and outcome quality (Stiakakis and Georgiadis, 2011). The mobile technology has led to tremendous innovation in the ride-hailing industry (Sarvepalli and Prakash, 2016). Venkatesh and Easaw (2015) has proposed different performance drivers like responsiveness, flexibility, reliability, tangibility, profitability, cost and resource utilization for this industry.
Since the expectation component across the different versions of service quality models has been severely criticized and it has been concurred that only perceptual component significantly influences the service quality (Boulding et al., 1993; Holdford and Patker, 2003; and Abdullah, 2006), for the purpose of the current study, which is aimed at comparing the perceived service quality of cab aggregators and traditional public transport services, SERVPERF model has been employed.
Data and Methodology
In order to investigate and compare the service quality of cab aggregators and traditional transportation service, appropriate research methodology has been employed. Descriptive research design has been used in the current study. It is based on primary data collected from people who use traditional public transportation services and the services of cab aggregators in the National Capital Region (NCR) of India. Accordingly, for the purpose of study, traditional public transport services have been defined to include buses, trains, feeder buses, auto rikshaw, rickshaw, e-rickshaw, grameen sewa/phat-phat sewa, etc. Delhi metro has not been included in the definition of traditional public transport.
Sampling technique is the process of choosing a representative sample out of the population for the study. Purposive sampling technique has been employed to collect the data. This technique has been used because for the purpose of this study, only those respondents who have used services of both cab aggregators and traditional public transport services in the NCR have been included. Probability sampling methods could not be employed because of this reason in the study.
Questionnaires were administered online as well as offline for collecting the data. A total of 429 responses were received out of which 387 questionnaires were complete in all aspects. Hence, 387 responses have been considered for data analysis.
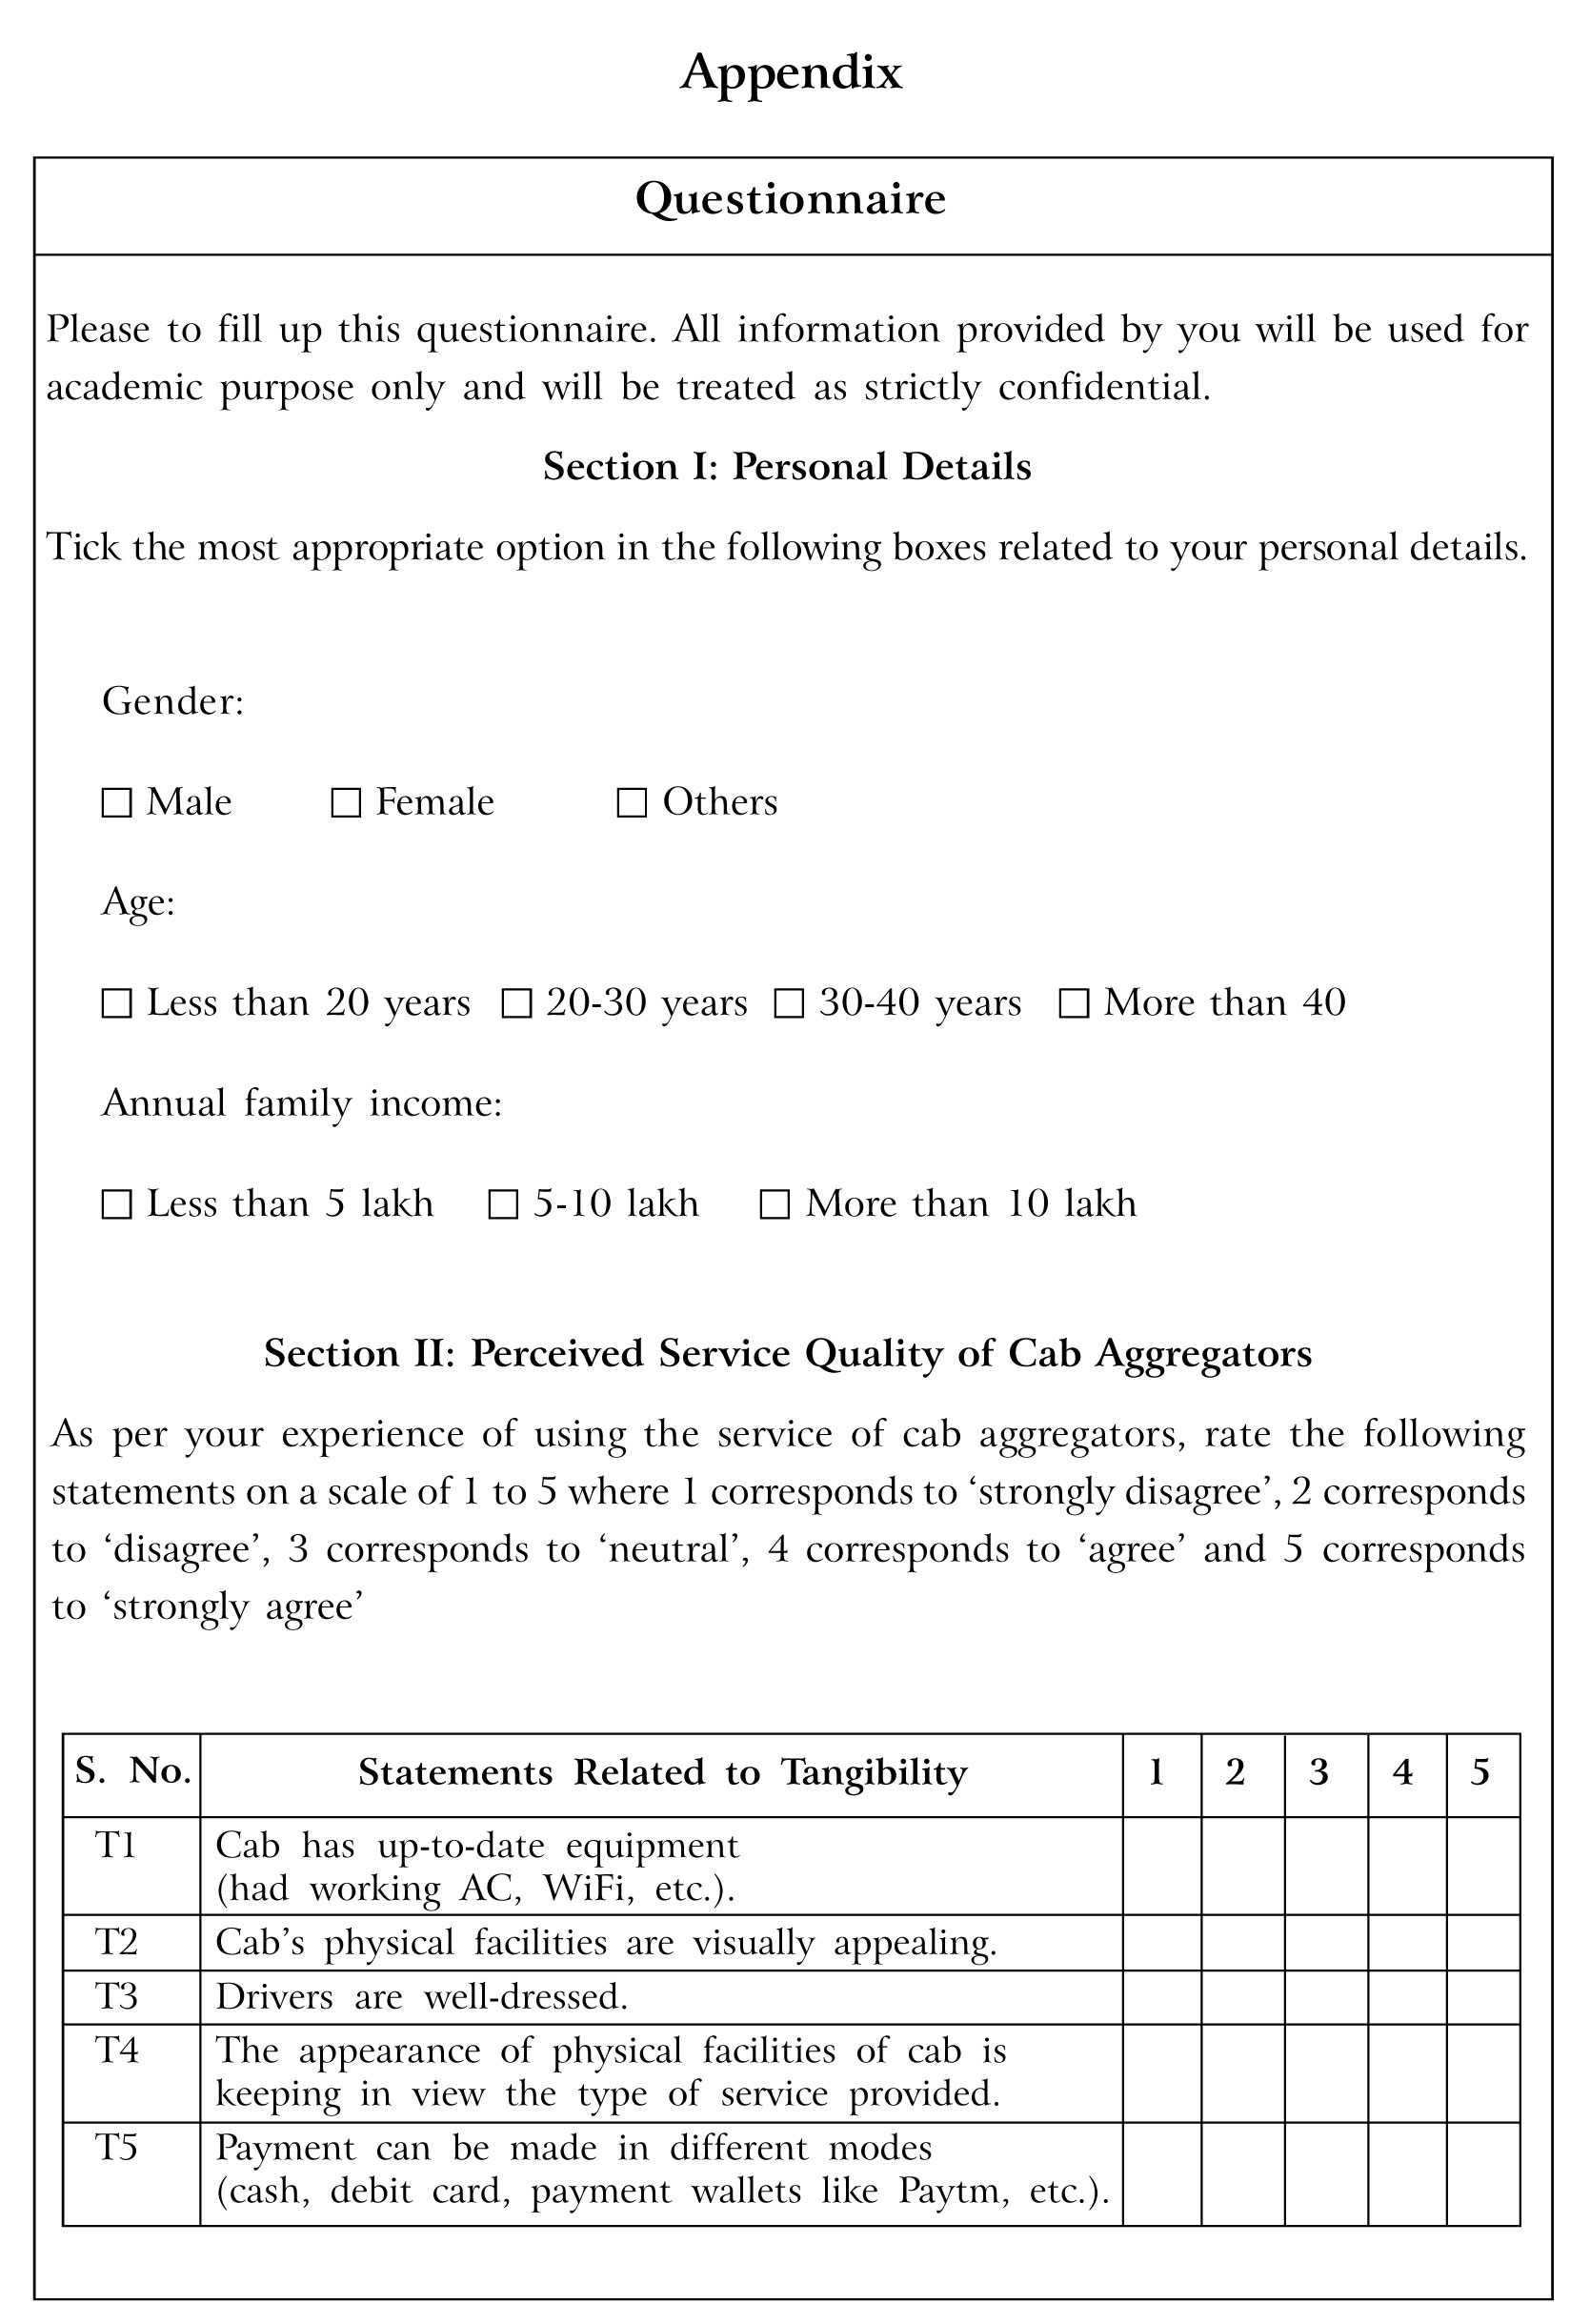
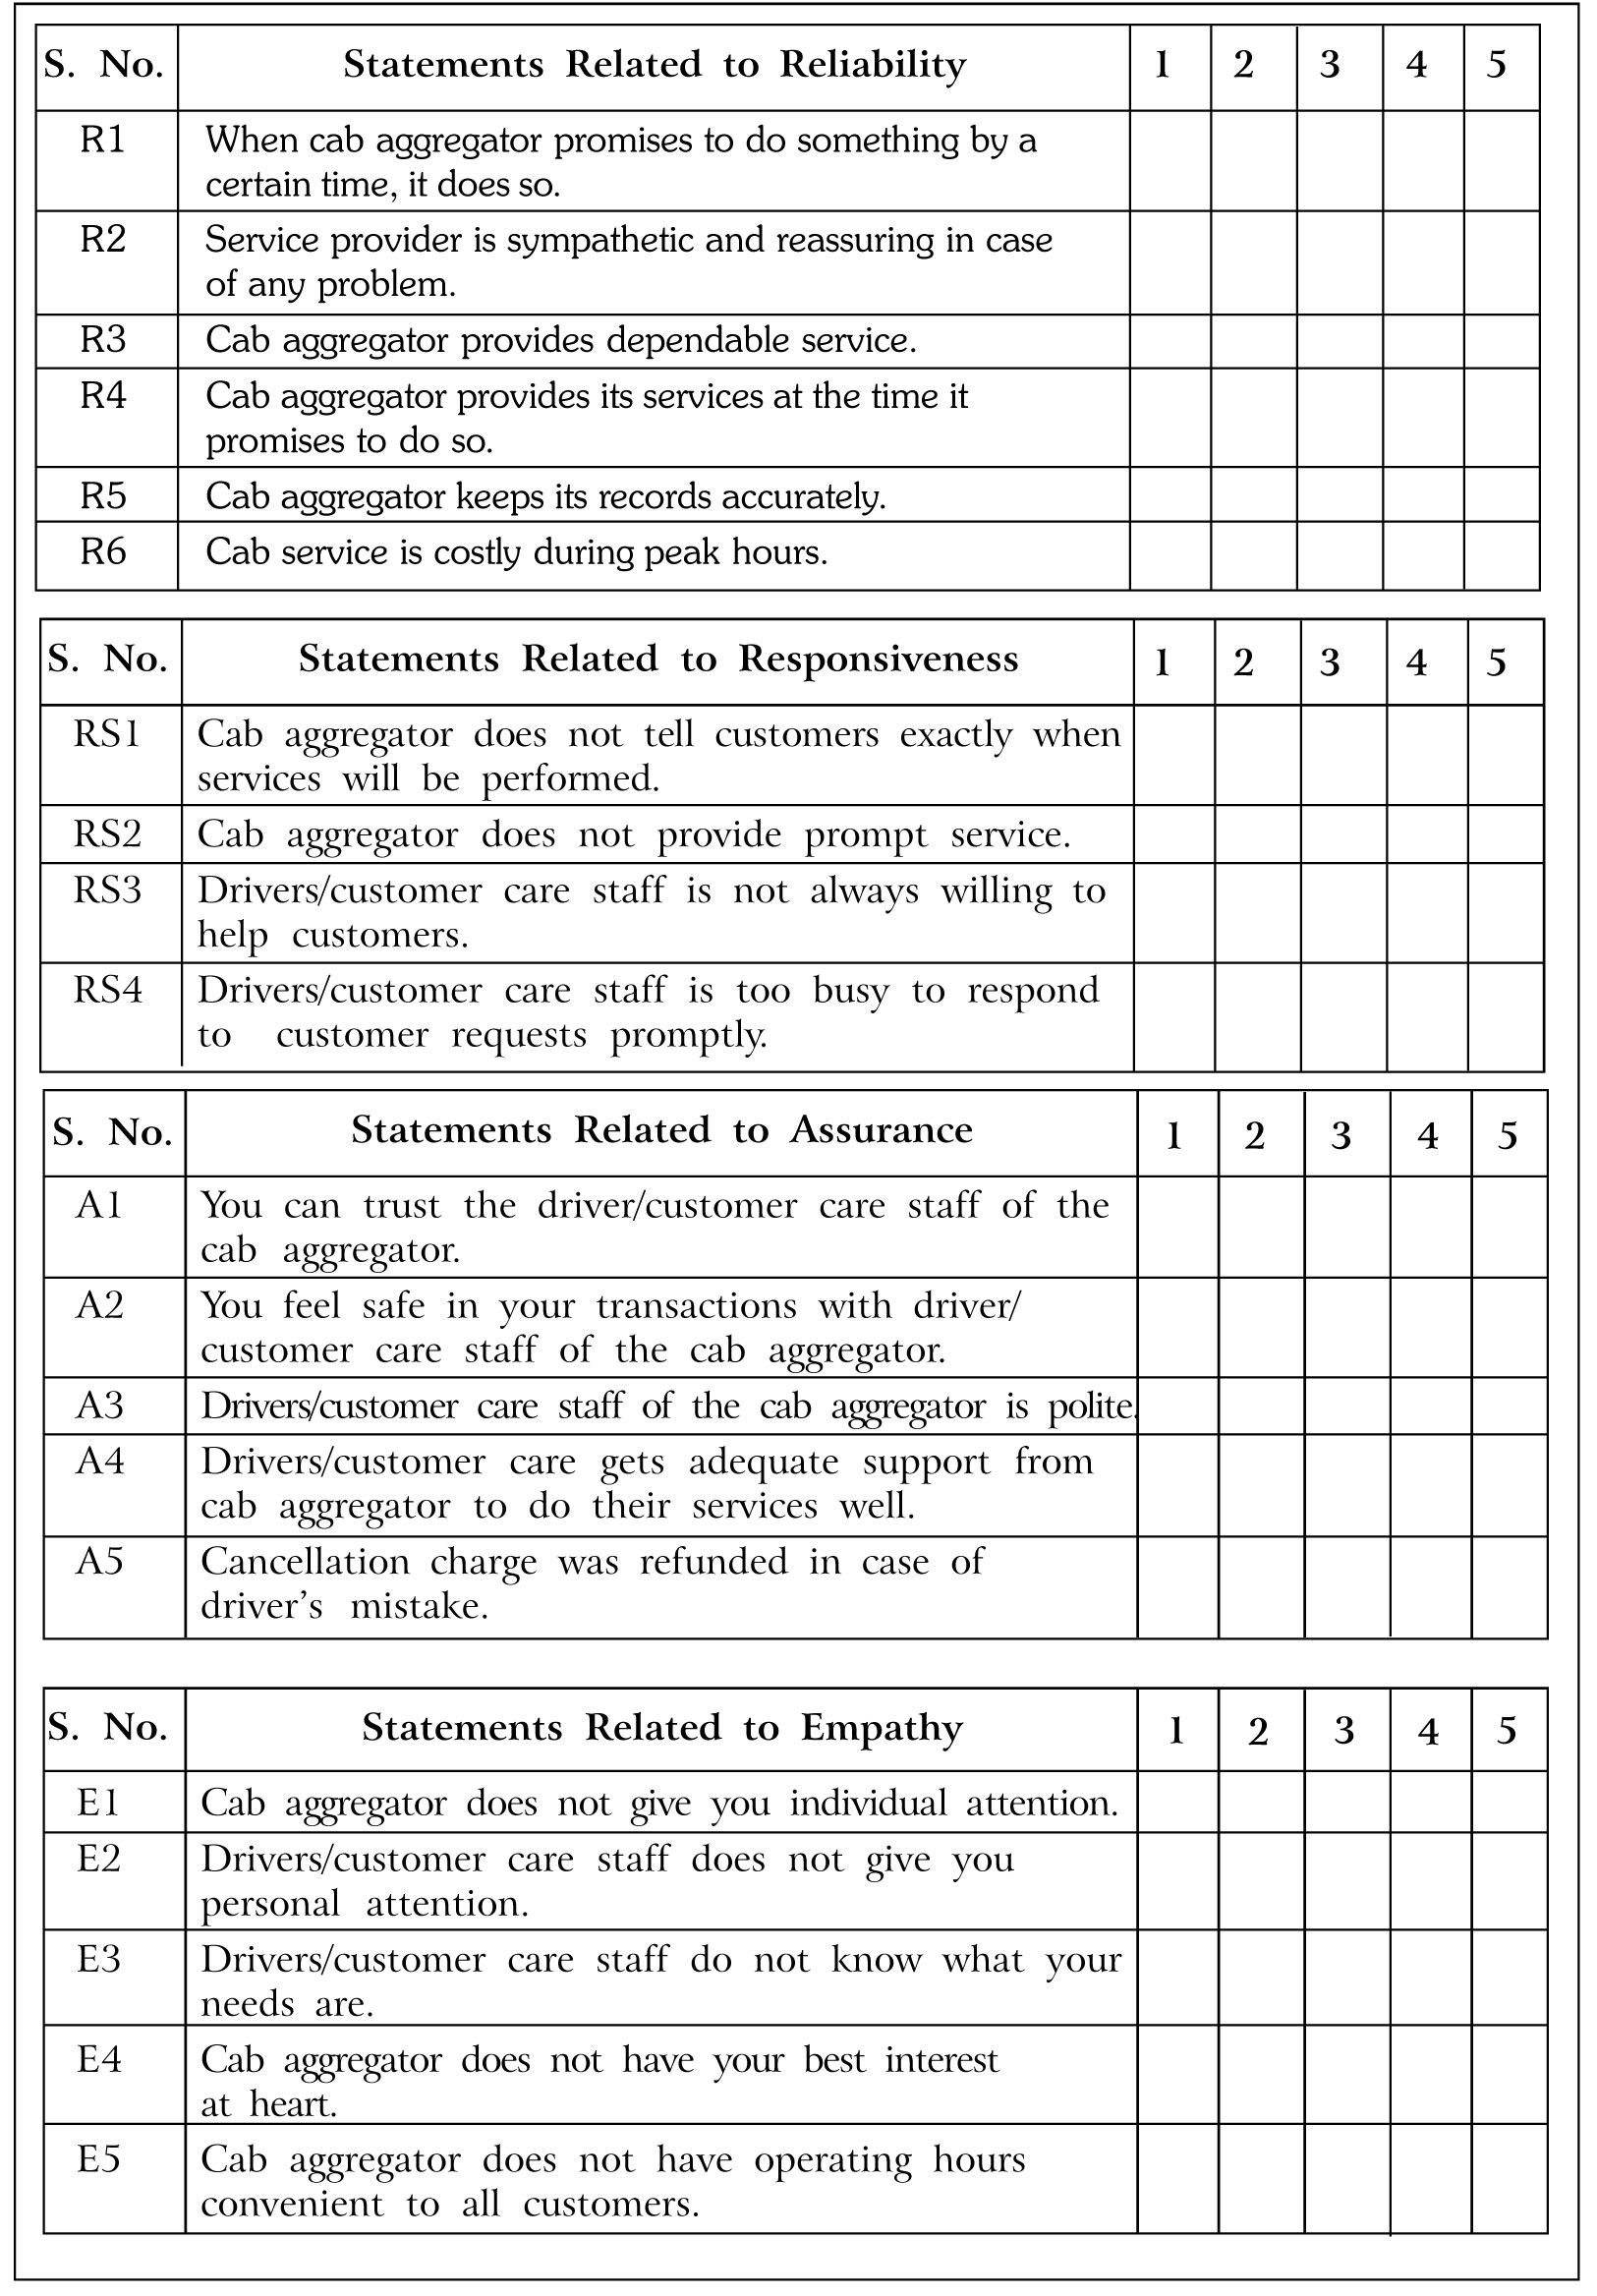
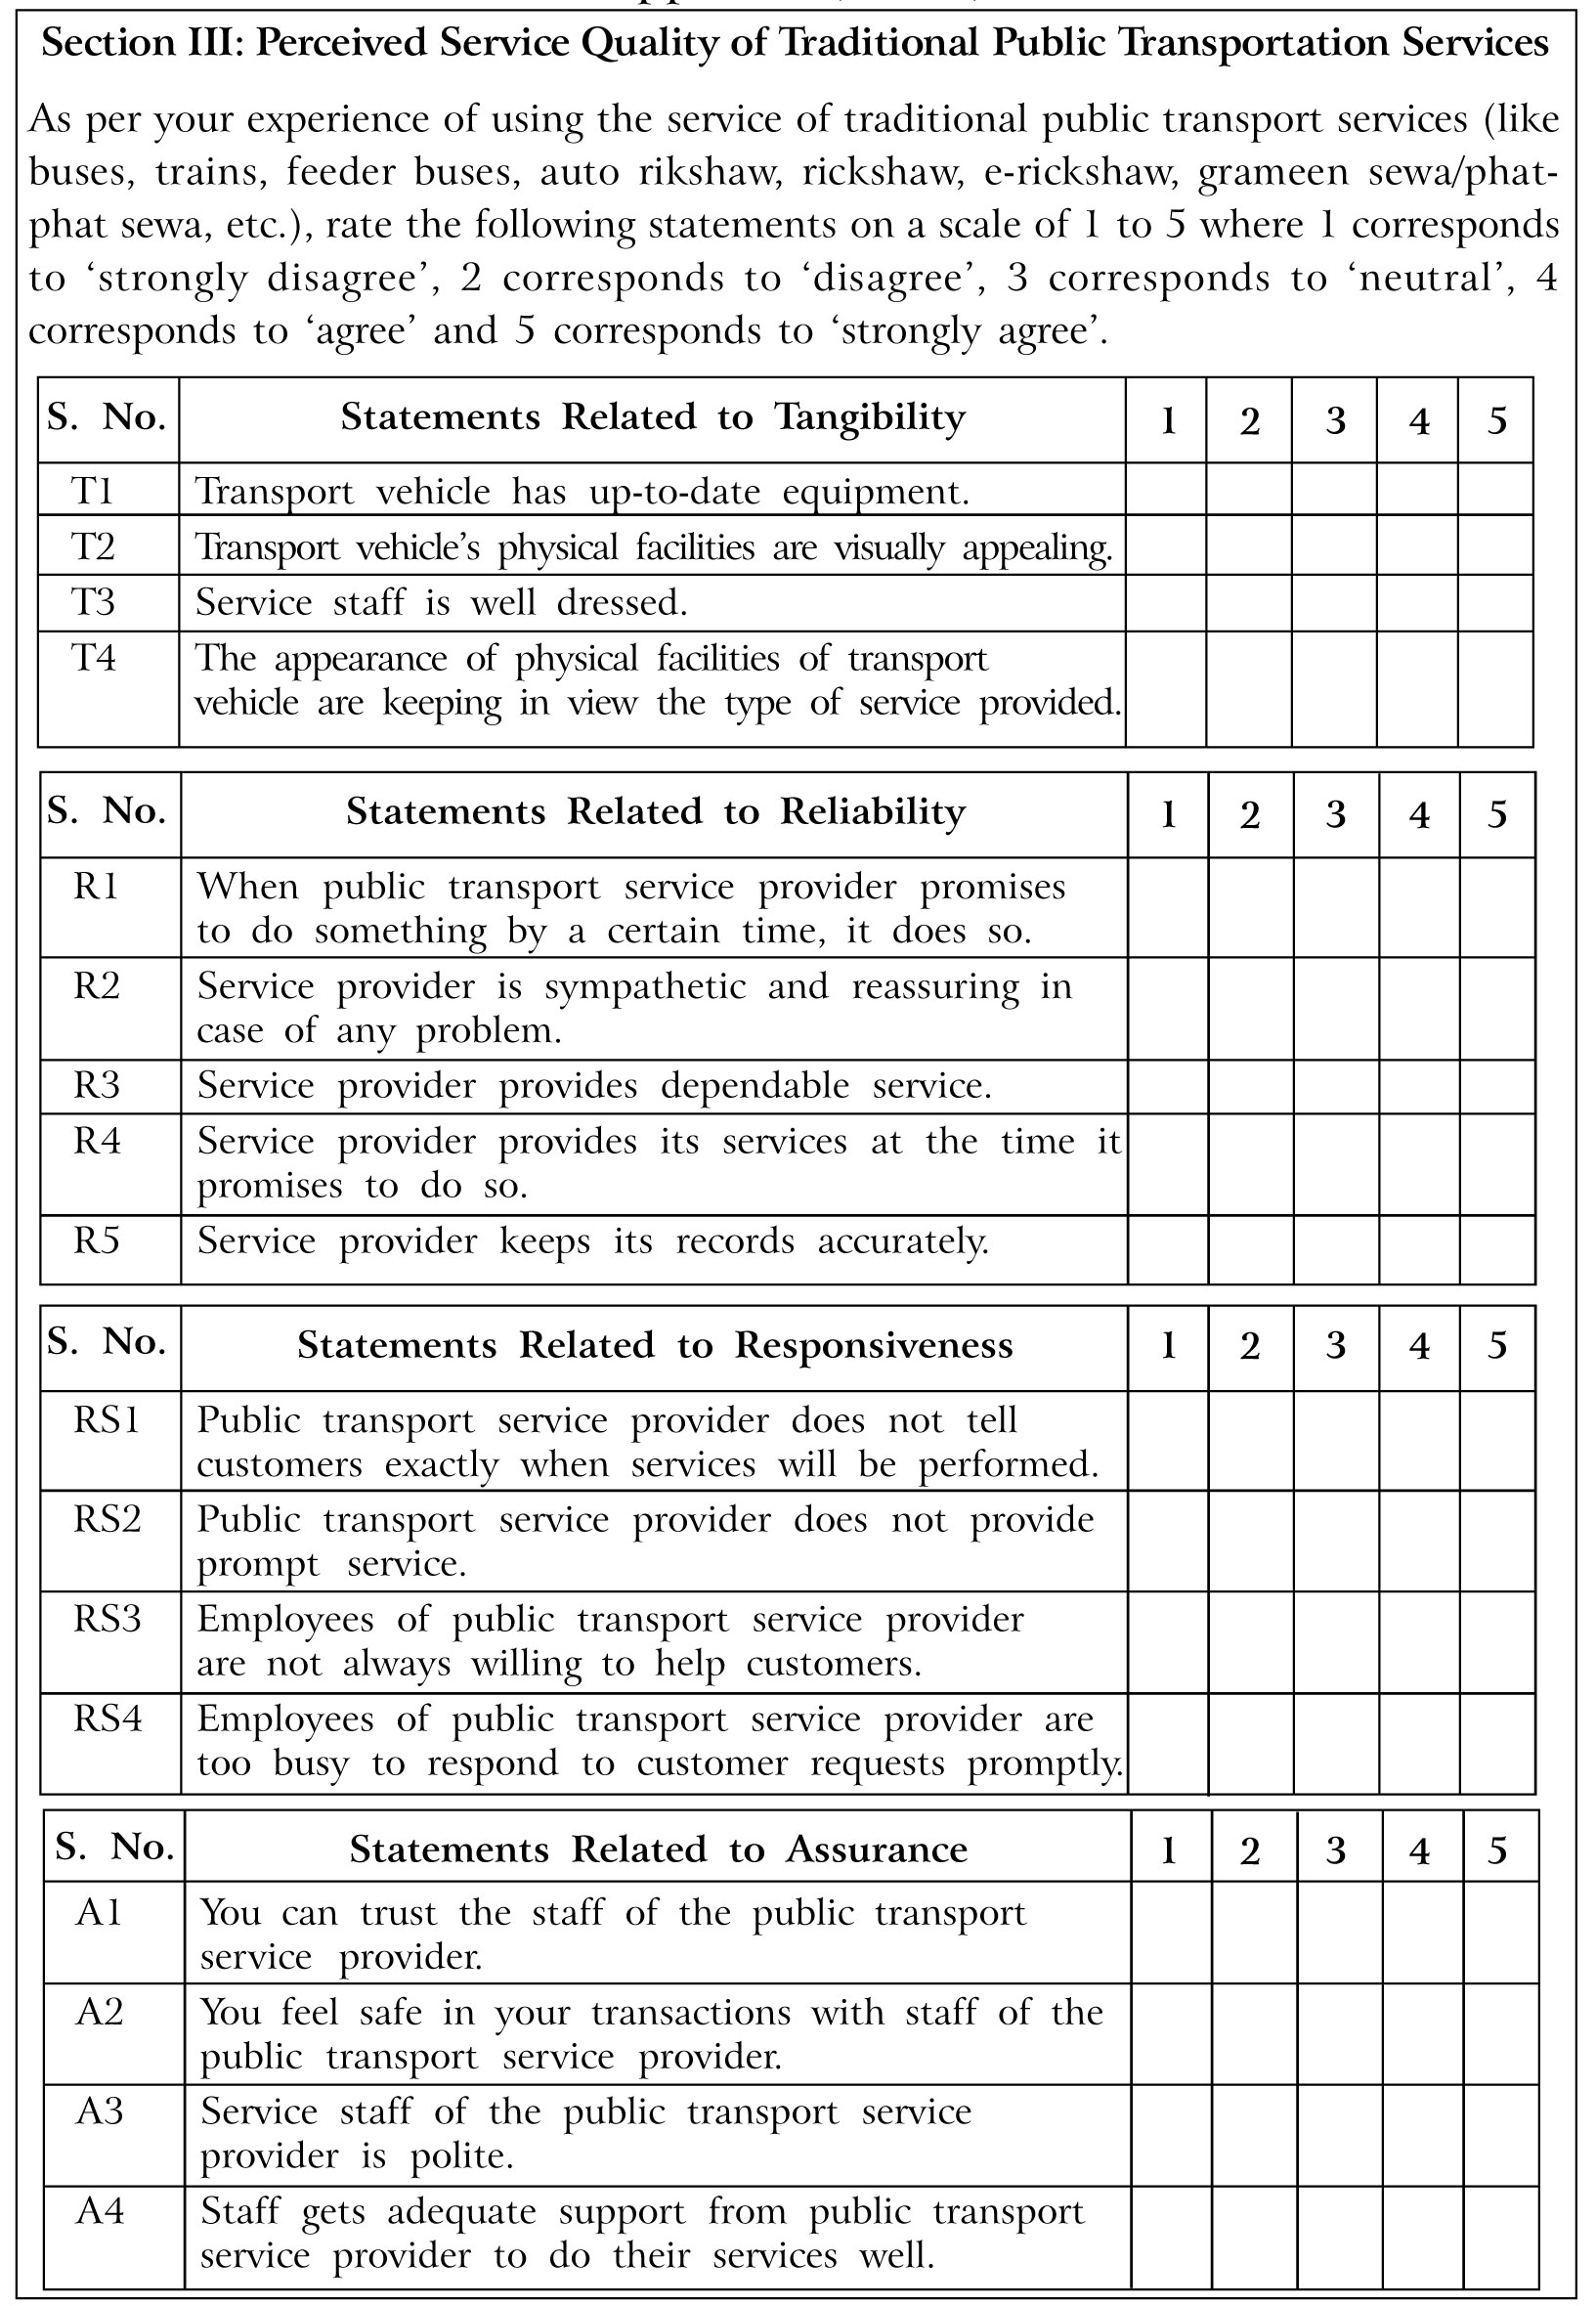
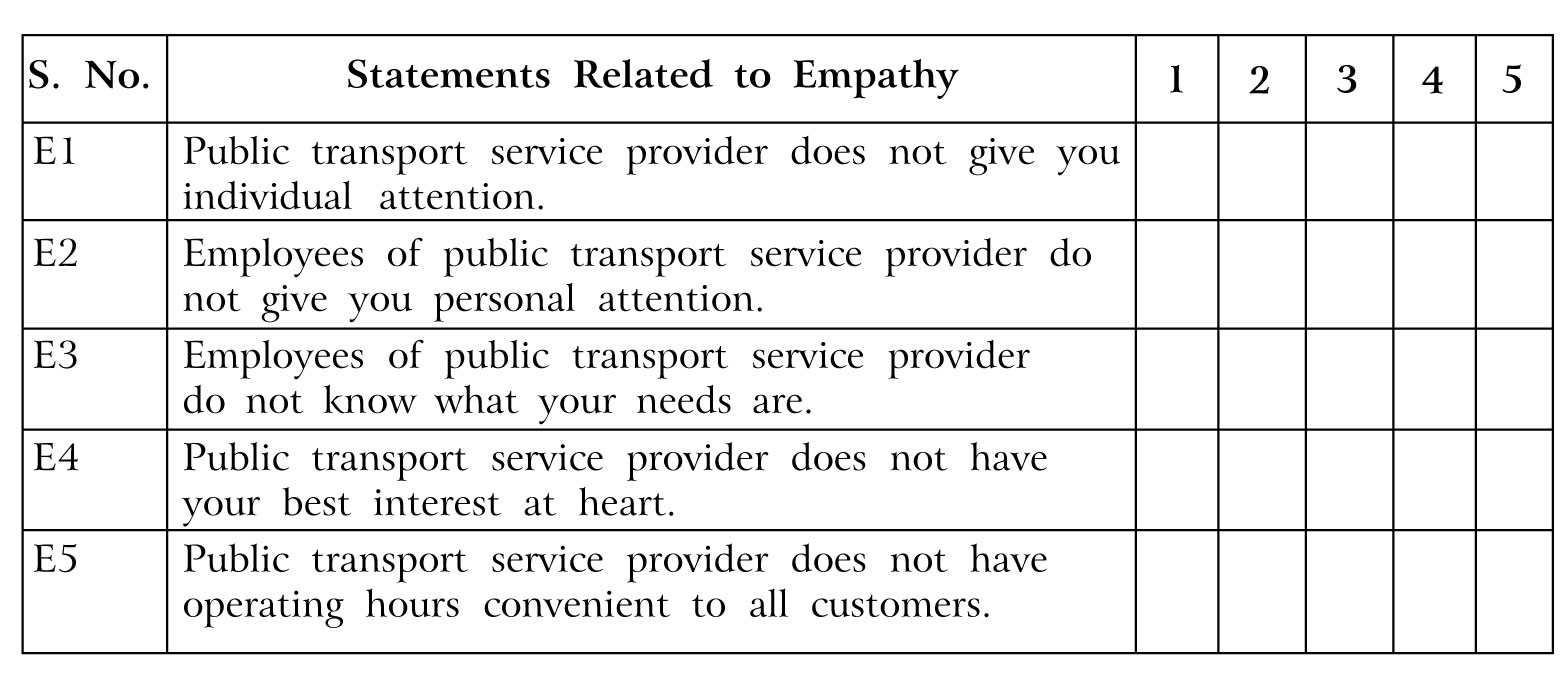
Data was collected on a 5-point Likert scale using a self-administered questionnaire (see Appendix). Standardized questionnaire has been used for the study. The research instrument has 25 statements (items) grouped across five dimensions (tangibility, reliability, responsiveness, assurance and empathy) which relate to measurement of perceived service quality of cab aggregators. Out of 25 items, 22 items are modified from standardized items. Their validity and reliability is well established. Three other items, namely, "Payment can be made in different modes (cash, debit cards, payment wallets)", "Cab was costly during peak hours" and "Cancellation charge was refunded in case of driver's mistake" have been taken after conducting review of literature (Uthira, 2018). Further, the instrument has 22 items adopted from standardized items which have grouped across five dimensions pertaining to measurement of perceived service quality of traditional public transport services.
Hypotheses
The following hypotheses were tested:
H01: There is no significant difference in perceived service quality of cab aggregators and traditional public transport services with respect to tangibility.
H11: There is a significant difference in perceived service quality of cab aggregators and traditional public transport services with respect to tangibility.
H02: There is no significant difference in perceived service quality of cab aggregators and traditional public transport services with respect to reliability.
H12: There is a significant difference in perceived service quality of cab aggregators and traditional public transport services with respect to reliability.
H03: There is no significant difference in perceived service quality of cab aggregators and traditional public transport services with respect to responsiveness.
H13: There is a significant difference in perceived service quality of cab aggregators and traditional public transport services with respect to responsiveness.
H04: There is no significant difference in perceived service quality of cab aggregators and traditional public transport services with respect to assurance.
H14: There is a significant difference in perceived service quality of cab aggregators and traditional public transport services with respect to assurance.
H05: There is no significant difference in perceived service quality of cab aggregators and traditional public transport services with respect to empathy.
H15: There is a significant difference in perceived service quality of cab aggregators and traditional public transport services with respect to empathy.
Results and Discussion
Descriptive Statistics: Demographic information pertaining to sample like gender, age and annual family income was ascertained. Out of the 387 respondents, 192 were males and 195 females. In terms of age, a majority of the respondents belong to the age group of 20-40 years, i.e., 335 while 16 and 36 respondents belonged to less than 20 and more than 40 age groups. Further, with regard to income, 68 respondents (18%), 164 respondents (42%) and 155 respondents (40%) belonged to income group of less than 5 lakh, 5-10 lakh and more than 10 lakh respectively.
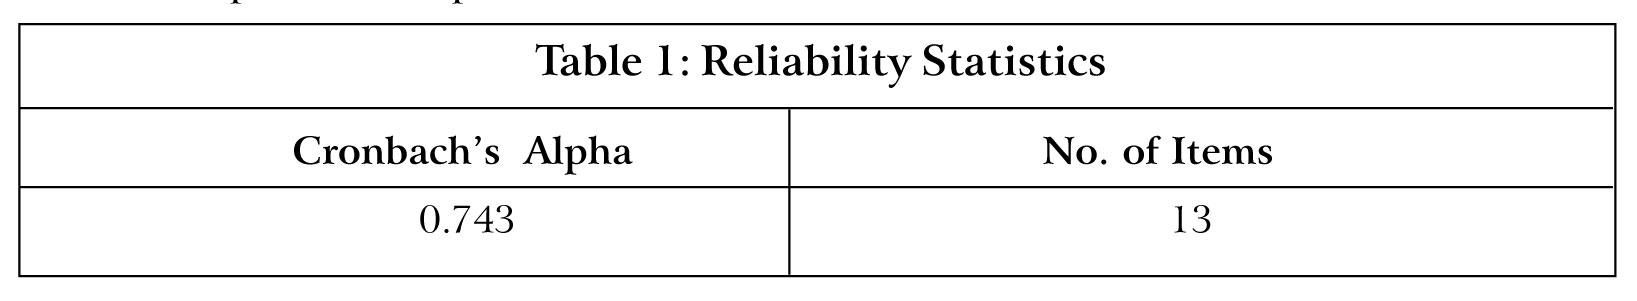
Reliability Testing: After collecting the data, it is pertinent to check the data for reliability. Cronbach's alpha is one of the methods to assess reliability. Its value should be more than 0.7 for the data to have an acceptable level of internal consistency. The Cronbach's alpha, calculated for reliability, for all the items is found to be 0.743 (Table 1) which indicates an acceptable level of internal consistency. 13 items comprise gender, age, annual family income, measurement of dimensions pertaining to tangibility, reliability, responsiveness, assurance and empathy relating to services of both cab aggregators and traditional public transportation services.
ypotheses Testing: For the objective of comparing perceived service quality of cab aggregators and traditional public transport services, the paired sample t-test is used.
A paired (dependent) sample t-test is employed when we have different set of observations for the same group. In such situation, each pair of observation has direct relation and both the pairs have equal number of data points. Prior to conducting the said analysis, the assumption pertaining to normally distributed mean differences is checked. For normally distributed mean differences, the conditions of level of skew < |2| and kurtosis < |9| should be satisfied (Posten, 1984).
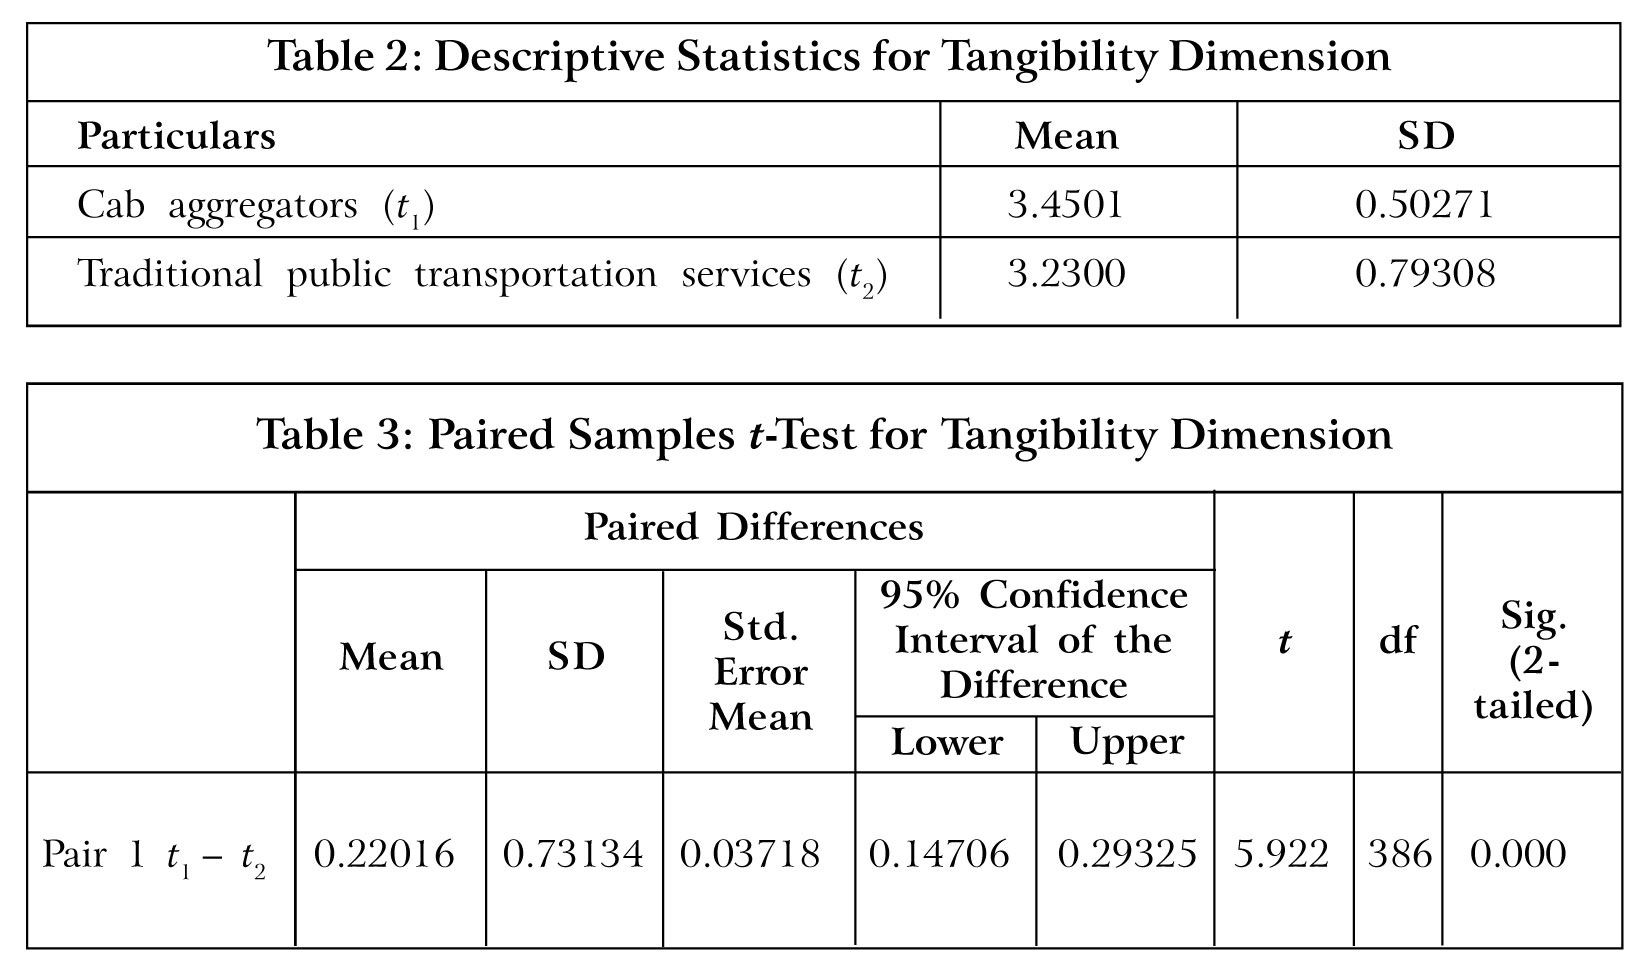
To test the hypothesis with respect to tangibility, there is no significant difference in perceived service quality of cab aggregators (M = 3.4501, SD = 0.50271) and traditional public transport services (M = 3.2300, SD = 0.79308) (Table 2), paired sample t-test was done. The skew and the kurtosis level has been calculated as 0.302 and -0.444 respectively in this case, which imply normally distributed mean differences. Hence, paired t-test can be used here. The null hypothesis of equal perceived service quality of cab aggregators and traditional public transport service was rejected, t(386) = 5.922, p < 0.001 (Table 3). Hence, there is a significant difference in perceived service quality of cab aggregators (t1) and traditional public transport services (t2) with respect to tangibility.
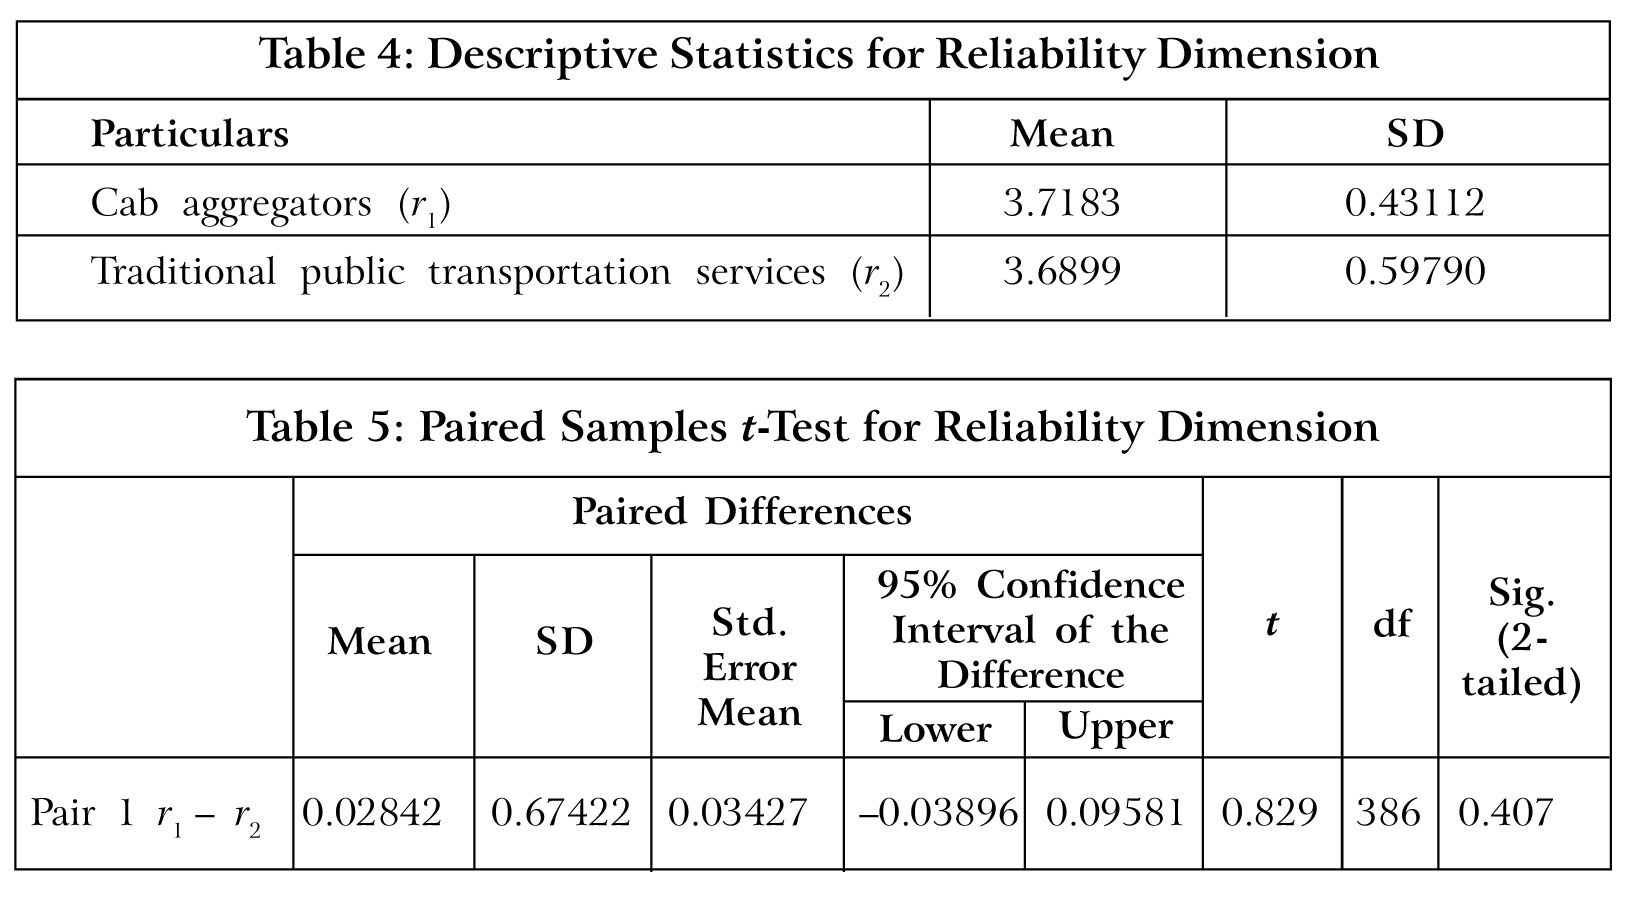
To test the hypothesis that with respect to reliability, there is no significant difference in perceived service quality of cab aggregators (M = 3.7183, SD = 0.43112) and traditional public transport services (M = 3.6899, SD = 0.59790) (Table 4), paired sample t-test is done. The skew and the kurtosis level has been calculated as 0.625 and 0.783 respectively in this case, which imply normally distributed mean differences. Hence, paired t-test can be used here. The null hypothesis of equal perceived service quality of cab aggregators and traditional public transport service cannot be rejected, t(386) = 0.829, p = 0.407
(Table 5). Hence, there is no significant difference in perceived service quality of cab aggregators (r1) and traditional public transport services (r2) with respect to reliability.
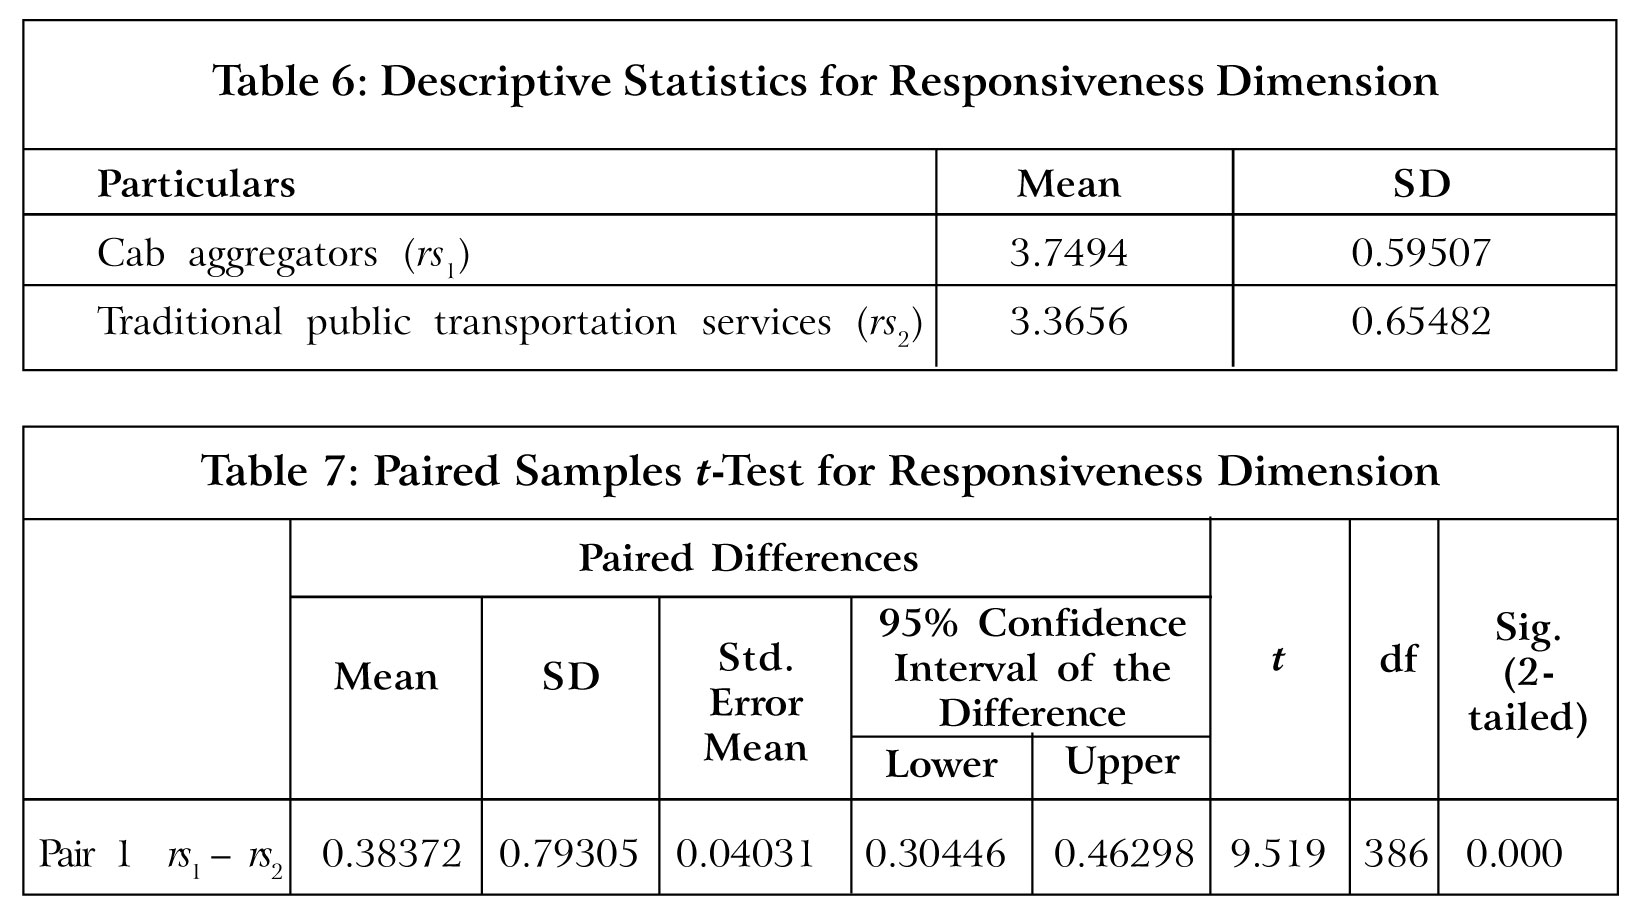
To test the hypothesis with respect to responsiveness, there is no significant difference in perceived service quality of cab aggregators (M = 3.7494, SD = 0.59507) and traditional public transport services (M = 3.3656, SD = 0.65482) (Table 6), paired sample t-test is done. The skew and the kurtosis level has been calculated as 0.224 and -1.617 respectively in this case, which imply normally distributed mean differences. Hence, paired t-test can be used here. The null hypothesis of equal perceived service quality of cab aggregators and traditional public transport service was rejected, t(386) = 9.519, p < 0.001 (Table 7). Hence, there is a significant difference in perceived service quality of cab aggregators (rs1) and traditional public transport services (rs2) with respect to responsiveness.
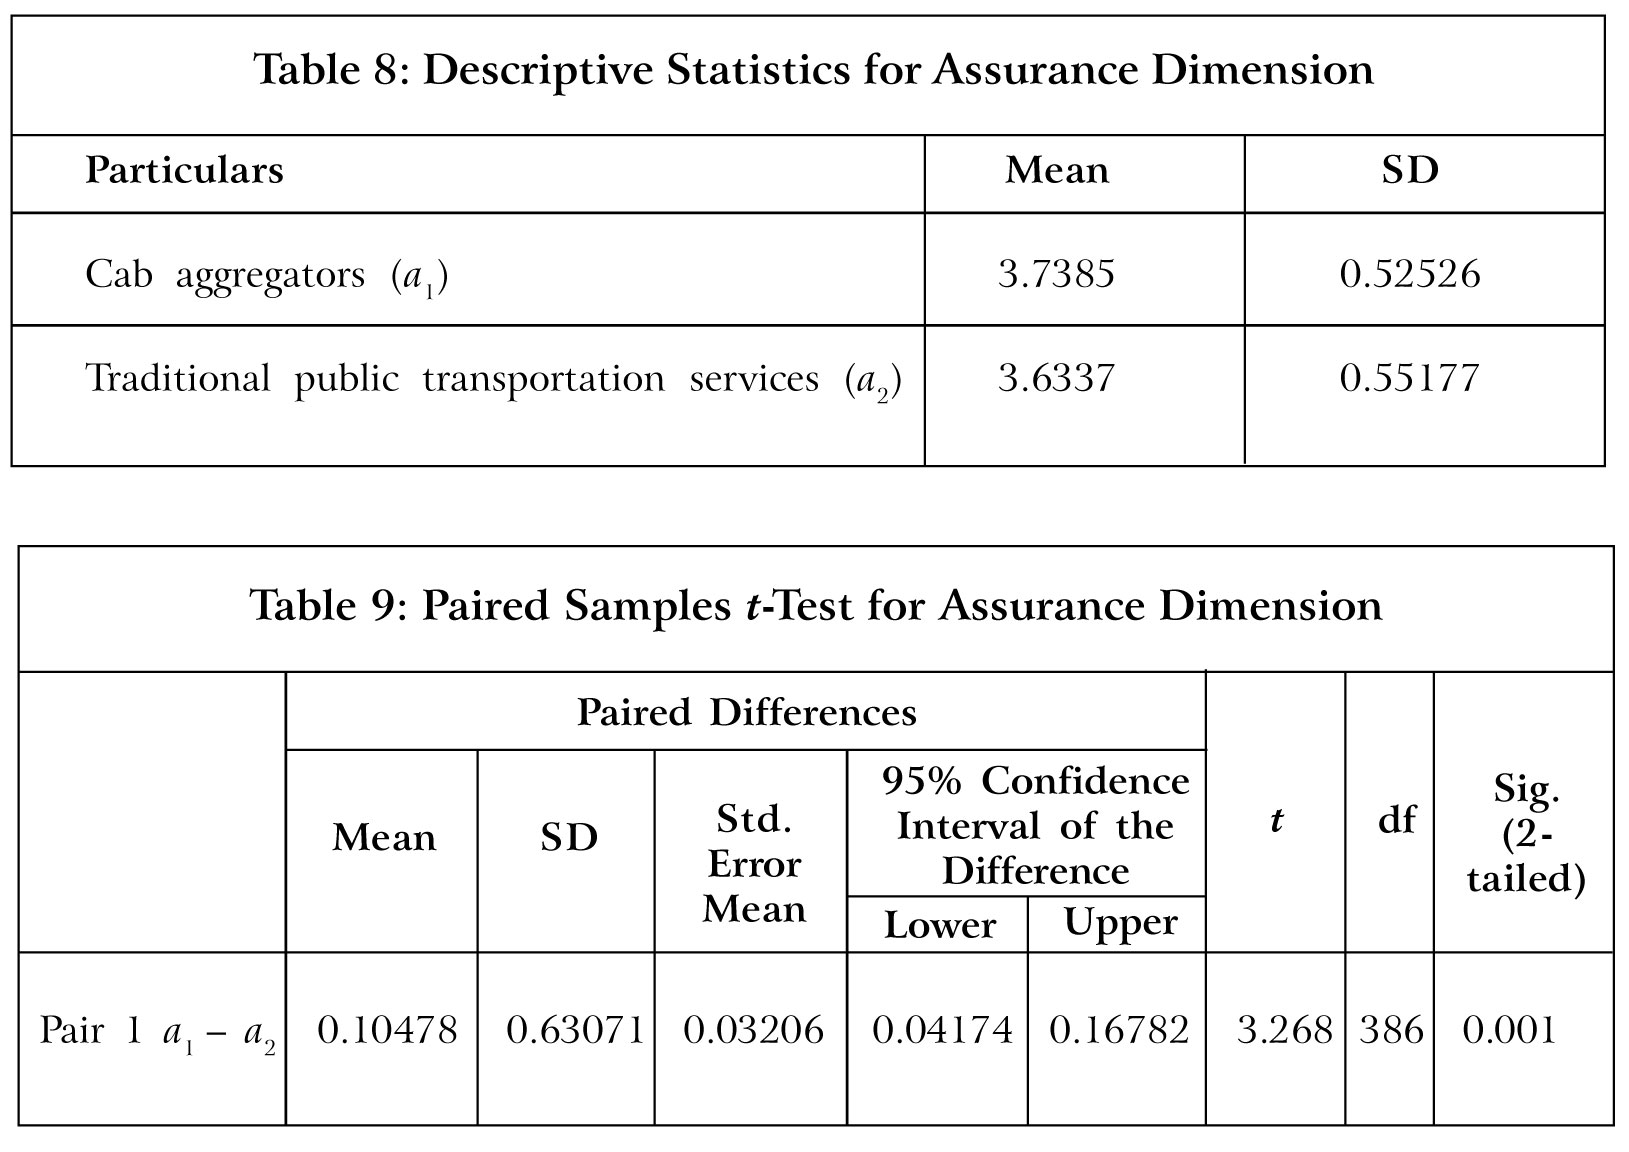
To test the hypothesis with respect to assurance, there is no significant difference in perceived service quality of cab aggregators (M = 3.7385, SD = 0.52526) and traditional public transport services (M = 3.6337, SD = 0.55177) (Table 8), paired sample t-test is done. The skew and the kurtosis level has been calculated as -0.051 and 0.285 respectively in this case, which imply normally distributed mean differences. Hence, paired t-test can be used here. The null hypothesis of equal perceived service quality of cab aggregators and traditional public transport service was rejected, t (386) = 3.268, p = 0.001 (Table 9). Hence, there is a significant difference in perceived service quality of cab aggregators (a1) and traditional public transport services (a2) with respect to assurance.
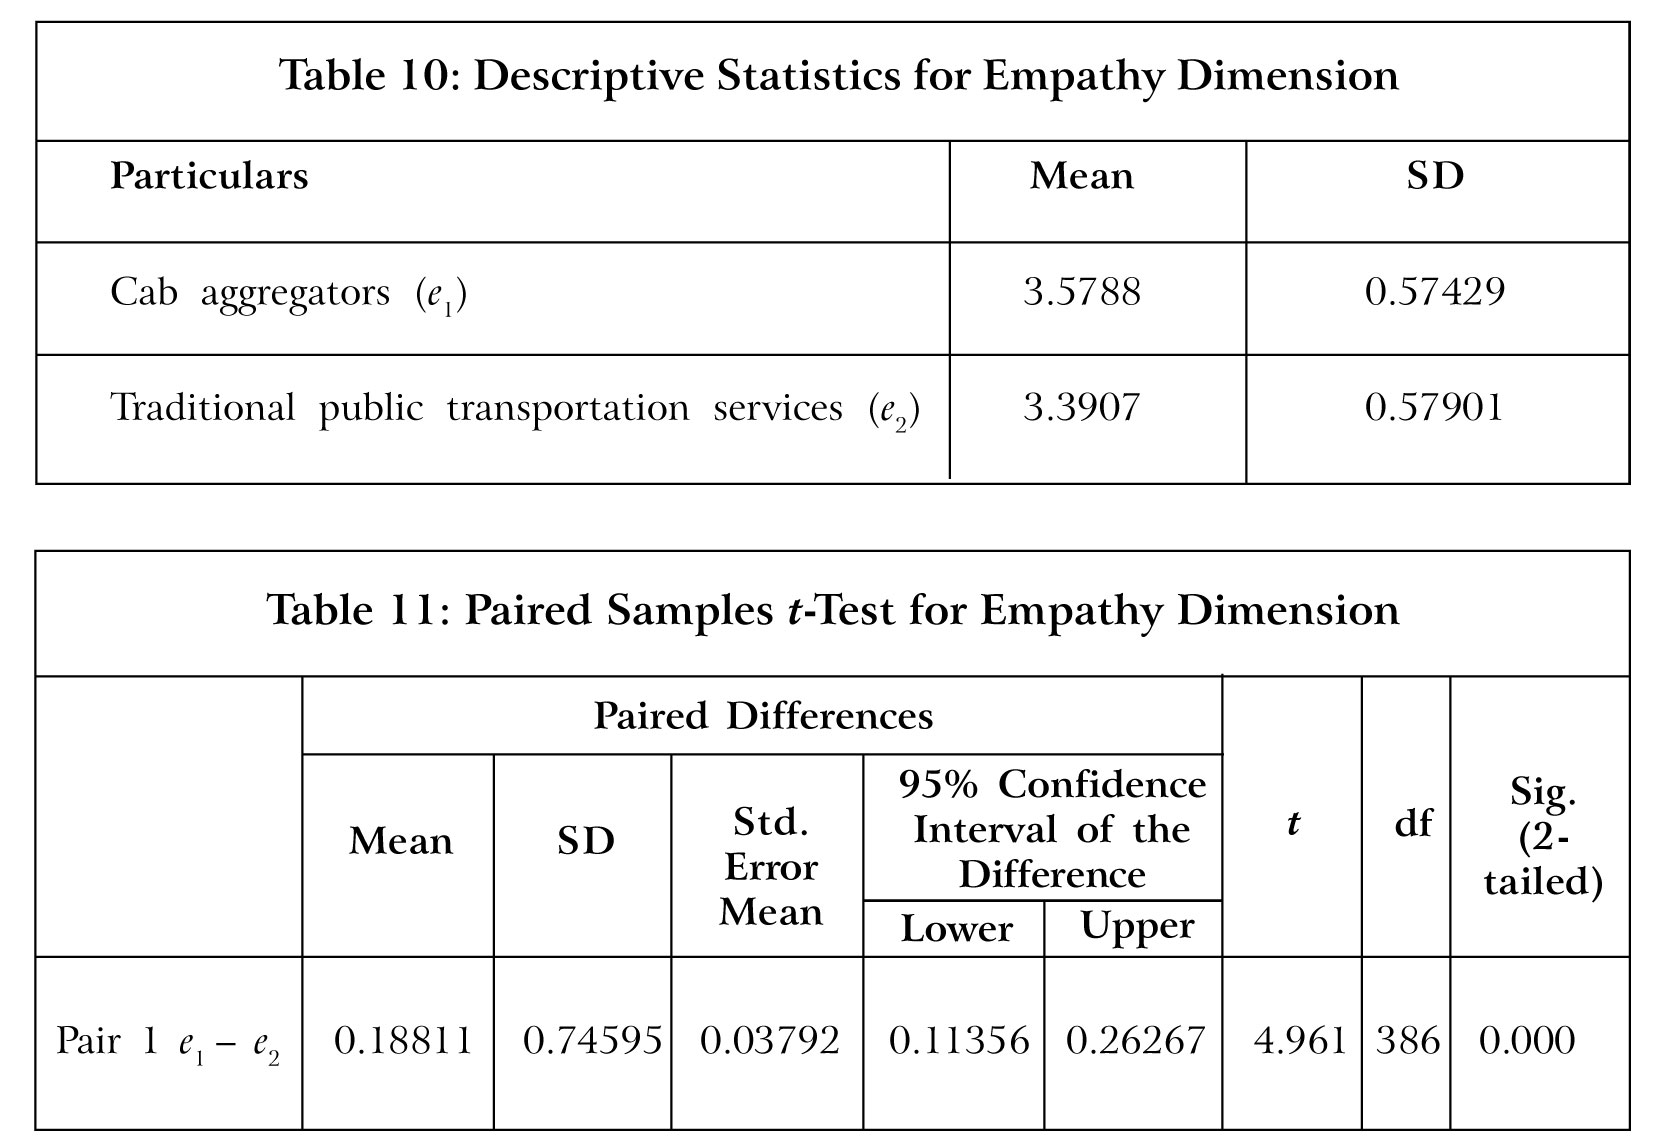
To test the hypothesis that with respect to empathy, there is no significant difference in perceived service quality of cab aggregators (M = 3.5788, SD = 0.57429) and traditional public transport services (M = 3.3907, SD = 0.57901) (Table 10), paired sample t-test is done. The skew and the kurtosis level has been calculated as 0.283 and -0.236 respectively in this case, which imply normally distributed mean differences. Hence, paired t-test can be used here. The null hypothesis of equal perceived service quality of cab aggregators and traditional public transport service was rejected, t (386) = 4.961, p < 0.001 (Table 11). Hence, there is a significant difference in perceived service quality of cab aggregators (e1) and traditional public transport services (e2) with respect to empathy.
Conclusion
The present study aims at comparing the perceived service quality of cab aggregators and traditional public transport services. Standardized SERVPERF scale has been used to fulfill the objective. The results indicate that perceived service quality of both the segments differs significantly along four dimensions, namely, tangibility, responsiveness, assurance and empathy, out of the five dimensions. However, in terms of reliability, there was no significant difference between the perceived service quality of cab aggregators and traditional public transport services. Hence, ride hailing platforms must take note of this aspect while delivering their services to better satisfy the customers. Enterprises which are already in the transportation industry or planning to enter should not brush aside the accuracy and dependability of the service provided by them. Hence, it brings out valuable insight for the transportation service providers and calls for future investigation into the matter.
Limitations: The current study has been carried out only in the NCR. Hence, considering the diversity in demographics and infrastructural differences across India, the results of the study may not be generalized to all parts of the country. The results are based on the opinion and since opinions are dynamic, this limitation cannot be ruled out. The results are also dependent upon the integrity of the respondent. Thus, biased or manipulated responses may severely undermine the veracity of the conclusion arrived at.
Future Scope: With the arrival of air taxi services and expansion of metro services across the country, the transportation industry is undergoing tremendous changes. Thereby, the need and the importance of study of passengers' perception of service quality, so as to provide valuable information about the industry, remains undeterred. Further research can be carried out by making a more comprehensive comparison by including such evolving public transportation services. J
References
- Abdullah F (2006), "Measuring Service Quality in Higher Education: HEdPERF Versus SERVPERF", Marketing Intelligence and Planning, Vol. 24, No. 1, pp. 31-47.
- Andreassen T W (1994), "Satisfaction, Loyalty, Reputation as Indicators of Customer Orientation in the Public Sector", International Journal of Public Sector Management, Vol. 7, No. 2, pp. 16-34.
- Andreassen T W (1995), "(Dis) Satisfaction with Public Services: The Case of Public Transportation", Journal of Services Marketing, Vol. 9, No. 5, pp. 30-41.
- Berry L and Parasuraman A (1997), "Listening to the Customer - The Concept of a Service Quality Information System", Loan Management Review, Vol. 38, No. 3, pp. 65-76.
- Boulding W, Kalra A, Staelin R and Zeithaml V A (1993), "A Dynamic Process Model of Service Quality: From Expectations to Behavioral Intentions", Journal of Marketing Research, Vol. 30, No. 1, pp. 7-27.
- Brady M and Cronin J (2001), "Some New Thoughts on Conceptualizing Perceived Service Quality: A Hierarchical Approach", Journal of Marketing, Vol. 65, No. 3, pp. 34-40.
- Cronin J and Taylor S (1992), "Measuring Service Quality: A Re-Examination and Extension", Journal of Marketing, Vol. 56, No. 3, pp. 55-68.
- Gronroos C and Ojasalo K (2004), "Service Productivity: Towards a Conceptualization of the Transformation of Inputs into Economic Results in Services", Journal of Business Research, Vol. 57, No. 4, pp. 414-423, available at http://doi:10.1016/S0148-2963(02)00275-8
- Holdford D and Patker A (2003), "Identification of the Service Quality Dimensions of Pharmaceutical Education", American Journal of Pharmaceutical Education, Vol. 67, available at DOI: 10.5688/aj6704108
- Hensel J (1990), "Service Quality Improvement and Control: A Customer-Based Approach", Journal of Business Research, Vol. 20, No. 1, pp. 43-54.
- Hood C (1995), "The New Public Management in the 1980s; Variations on a Theme", Accounting, Organization Society, Vol. 20, Nos. 2&3, pp. 95-109.
- Huang E Y, Lin S W and Fan Y C (2015), "MS-QUAL: Mobile Service Quality Measurement", Electronic Commerce Research and Application, Vol. 14, No. 2, pp. 126-142.
- Johns N (1992), "Quality Management in the Hospital Industry: Part 1. Definition and Specification", International Journal of Contemporary Hospitality Management, Vol. 4, No. 3, available at https://doi.org/10.1108/09596119210014219
- Khurana S (2014), "The Relationship Between Service Quality and Customer Satisfaction: An Empirical Study of the Indian Banking Industry", IUP Journal of Bank Management, Vol. 13, No. 4, pp. 51-62.
- Liu B, Sudharshan D and Hamer L (2000), "After-Service Response in Service Quality Assessment: A Real-Time Updating Model Approach", Journal of Service Marketing, Vol. 14, No. 2, pp. 160-177.
- Parasuraman A P, Zeithaml V A and Berry L L (1985), "A Conceptual Model of Service Quality and its Implication for Future Research (SERVQUAL)", Journal of Marketing, Vol. 49, pp. 41-50.
- Parasuraman A, Zeithaml V A and Barry L L (1988), "Servqual: A Multiple-Item Scale for Measuring Consumer Perception", Journal of Retailing, Vol. 64, No. 1, pp. 12-34.
- Parasuraman A, Berry L L and Zeithaml V (1991), "Refinement and Reassessment of the SERVQUAL Scale", Journal of Retailing, Vol. 57, No. 3, pp. 25-48.
- Parasuraman A, Zeithaml V and Malhotra A (2005), "E-S-QUAL: A Multiple-Item Scale for Assessing Electronic Service Quality", Journal of Service Research, Vol. 7. No. 3, pp. 213-233.
- Posten H O (1984), "Robustness of the Two-Sample T-Test, Robustness of Statistical Methods and Nonparametric Statistics", Rasch D and Tiku M L (Eds.), Theory and Decision Library (Series B: Mathematical and Statistical Methods), Vol. 1. Springer, Dordrecht, available at DOI: 10.1007/978-94-009-6528-7_23
- Rust T R and Oliver L R (2002), "Should We Delight the Customer?", Journal of the Academy of Marketing Science, Vol. 28, No. 1, pp. 86-94.
- Sarvepalli K K and Prakash N M (2016), "Cab Aggregation Industry in India - An Overview, Current Scenario, Issues and Possibilities for Consolidation", International Journal of Scientific Development and Research, Vol. 1, No. 4, pp. 317-324.
- Siddiqui M H and Sharma T G (2010), "Analyzing Customer Satisfaction with Service Quality in Life Insurance Services", Journal of Targeting, Measurement and Analysis for Marketing, Vol. 18, No. 3, pp. 221-238.
- Stiakakis E and Georgiadis C K (2011), "A Model to Identify the Dimensions of Mobile Service Quality", International Conference on Mobile Business (ICMB), Tenth International Conference, IEEE, Vol. 4, pp. 195-204.
- Tran T and Kleiner H B (2005), "Managing for Excellence in Public Transportation", Management Research News, Vol. 28, Nos. 11/12, pp. 154-163.
- Uthira D (2018), "A Diagnostic Study of the Cab Aggregation Industry Using the SERVQUAL Gap Model", International Journal of Marketing and Technology, Vol. 8, No. 6, pp. 59-84.
- Venkatesh G and Easaw G (2015), "Measuring the Performance of Taxi Aggregator Service Supply Chain", SAMVAD: SIBM Pune Research Journal, Vol. 10, No. 3, pp. 26-36.
- Zeithaml V A, Berry L L and Parasuraman A (1996), "The Behavioural Consequences of Service Quality", Journal of Marketing, available at DOI: 10.2307/1251929