Aug' 21
The IUP Journal of Marketing Management
Archives
Development of Post-Purchase Consumer Regret Scale in Case of Online Purchase of White Goods, Brown Goods and Consumer Electronics in Assam, India
Anannya Boruah
Doctoral Student, Assam Institute of Management (AIM) (under Assam Science and Technology University (ASTU)), Bigyan Path, Paschim Boragaon, Guwahati-781035, Assam, India; and is the corresponding author. E-mail: anannyaboruah18@gmail.com
Sinmoy Goswami
Assistant Professor, Assam Institute of Management (AIM), Bigyan Path, Paschim Boragaon,
Guwahati-781035, Assam, India. E-mail: sinmoy.goswami@gmail.com
Post-purchase consumer regret is a negative emotion which can be detrimental and result in negative consequences for both consumers and marketers. The purpose of this paper is to propose and validate a Post-Purchase Consumer Regret (PPCR) scale in case of online purchase of white goods, brown goods and consumer electronics and to identify specific groups of consumers who require special attention for reduction of PPCR. The data has been collected from secondary sources as well as primary source, where a questionnaire has been administered amongst 200 respondents. Confirmatory Factor Analysis (CFA) was conducted for validation of the PPCR scale developed and one-way ANOVA and Independent Sample t-test were used to identify respondent groups who need special attention for reducing chances of PPCR. The study has helped in validating a revised scale for measuring PPCR in case of the aforementioned goods. It further shows that the marketers of aforementioned goods should focus on female and married consumers to reduce PPCR. The present study will help to identify the gap in our current knowledge to capture one's level of PPCR and thereby help in reducing it.
Introduction
In the modern-day markets, an array of alternative brands have contributed to consumers' perplexity when making purchase decisions (Avi et al., 2006; and Penny et al., 2008). More involvement is necessary by consumers in the purchase decision-making process so that they select the most appropriate alternatives for them (Marcel and Rik, 2007). However, even after rational thinking and decision-making, the consumers may still be in doubt as to what extent their decisions were correct. As such, consumers evaluate the brands they bought with the alternatives they had decided not to buy (Graham and Robert, 1982; Landman, 1987; Terry and David, 1995; Avi et al., 2006; Terry and David, 1995; and Penny et al., 2008). When consumers perceive that their purchasing decisions are wrong, they regret (David, 1985; Landman, 1987; Michael and Vikas, 2000; and Mark et al., 2007).
Marcel and Rik (2006) stated that when an obtained outcome compares unfavorably with an outcome that could have been better (had the individual chosen differently), it is known as 'outcome regret'. Further, it was hypothesized that independent of outcomes, the quality of the decision process can also be regretted and when an individual compares their inferior decision process to a superior alternative decision process, it gives rise to process regret (Elizabeth and Willian, 1999; and Terry and Marcel, 2002).
Various studies on consumer behavior have shown that post-purchase regret is accompanied by low consumer satisfaction (Jeffrey et al., 1997; Shelley and Sherry, 1998; and Wilco and Marcel, 2002). This viewpoint is also supported by Michael and Vikas (2000), and Marcel et al. (1998). Low satisfaction of consumers does not lead to repurchase intention (Michael and Vikas, 2000), an inclination to shift to alternative brands (Marcel and Rik, 1999; My et al., 2011; and Isabel and Rafael, 2011), and negative word-of-mouth about the brand (Isabel and Rafael, 2011). According to Albert (1970), dissatisfied consumers seek redressal, while others leave silently with a no-repurchase intention. Thus, regret is a negative emotion which can prove disastrous for marketers.
Therefore, there is a need to understand the post-purchase regret behavior of consumers. Also, India is expected to become the fifth largest market for consumer durables in the world by 2025 (Kalaiselvi, 2017), and global online shopping is expected to rise to $4.48 tn in 2021 from $2.3 tn in 2017 (Isita and Juin, 2018). So, it is imperative to study the post-purchase regret behavior of consumers in case of online purchase of white goods, brown goods and consumer electronics (which are important consumer durables) (Shirang, 2014; and IBEF Report, 2019). This is also because of the fact that only by having greater awareness and understanding of post-purchase regret, marketers of such goods can attain better knowledge of the consumption experience of the consumers. In this regard, the present study aims to understand and develop a Post-Purchase Consumer Regret (PPCR) scale in case of online purchase of the above three categories of goods.
Literature Review
Regret is a cognitive emotion that people are motivated to keep away from, repress, refute, and control (Marcel et al., 1998; and Marcel and Rik, 2006). Regret is an agonizing feeling that arises as a result of comparing 'what is' with 'what might have been' (Robert, 1985).
Shirang (2014) stated that consumer durables are broadly segmented into home appliances and electronic goods. Home appliances have been further categorized into white goods (consisting of air conditioners, refrigerators, washing machines, sewing machines, watches and clocks, and cleaning equipments), and brown goods (consisting of microwave ovens, chimneys, mixer grinders, electric fans, iron, and other cooking ranges) (Shirang and Anil, 2014). Consumer electronics comprises television sets, audio visual equipment, electronic accessories, personal computers, mobile phones, digital cameras, camcorders, and Digital Video Disks (DVDs) (Shirang and Anil, 2014).
According to the report of Care Ratings on Consumer Durables Industry - Structure and Prospects (2018), consumer durables have been broadly classified as consumer appliances and consumer electronics. Consumer appliances (or domestic appliances) are further classified as 'white goods' and 'brown goods'. White goods include air conditioners, washing machines and refrigerators. As per the same report, brown goods comprises microwave ovens, mixer grinders, juicers, irons, blenders, toasters, coffee makers, sewing machines, electric fans, cleaning equipments, dryers, heating appliances, dishwashers, vacuum cleaners, water coolers and water purifiers. Consumer electronics consists of televisions and home theater systems, audio and video systems, personal computers and peripherals, digital cameras, mobile phones and accessories, laptops and accessories, tablets, gaming consoles, DVD and MP3 players, audio equipments and speakers. The above categorization has been supported by Bhawaniprasad and Kumari (1987), Teh-Wei et al. (1989), Barry (1991), Jai-Ok et al. (2002); and Shirang and Anil (2014).
According to IBEF Report (2019), consumer durables have been divided into two categories, namely, consumer electronics (brown goods) and consumer appliances (white goods). Consumer electronics comprises televisions, CD and DVD players, laptops, electronic accessories, audio and video systems, personal computers, digital cameras and camcorders. Consumer appliances comprises air conditioners, washing machines, electric fans, microwave ovens, refrigerators, sewing machines and cleaning equipment (IBEF Report 2019).
Need for the Study
The above-mentioned discussion has provided a detailed understanding regarding the concept of regret and PPCR in particular. Marcel and Rik (2007) mentioned about the significant increase in studies related to regret. However, previous studies have not been sufficient in measuring the multidimensional components of regret, or carried the necessary stringency and the proper validation technique required for developing scales (Gilbert, 1979). It may be noted that proper understanding of the concept of PPCR is highly important for the field of marketing management (Marcel et al., 1998). Seung and June (2009) tried to conceptualize the multiple dimensions of PPCR in their study and propounded a PPCR scale which has been studied in detail in this study. However, none of the above studies on regret and PPCR dealt exclusively with online purchase of white goods, brown goods, and consumer electronics, which reflects a significant gap in this regard. This clearly highlights an urgent need to understand PPCR in detail in order to formulate steps and strategies to minimize it in the case of online purchase of the above categories of goods. Reduction in PPCR with respect to the aforesaid goods will certainly help in lowering chances of post-purchase dissatisfaction of consumers (Jeffrey et al., 1997; Shelley and Sherry, 1998; Elizabeth and Willian, 1999; and Michael and Vikas, 2000). Such consumer dissatisfaction has adverse effects including consumers switching to rival brands. Reduction in PPCR may also result in increased consumer satisfaction (Ali and Coskun, 2007; and Eduardo et al., 2008). The latter will lead to increased repurchase intention (in case of such goods) which itself is an antecedent of consumer loyalty (Sung-Joon and Joo-Ho, 2000; Dwayne et al., 2004; Desmond, 2007; and Hong-Youl et al., 2010). In short, repeat purchase intention will definitely result in more loyal consumers and also spread a positive word-of-mouth regarding specific brands of aforementioned products thereby attracting new consumers (Anne, 2003; Chao-Min et al., 2014; and Ruth et al., 2016). This will not only help in sustaining the present consumer base but will also aid in its expansion through addition of new consumers. This will result in consistent increase and maintenance of profitability and survivability of firms manufacturing and selling the above types of goods (Hong-Youl et al., 2010).
In the above context, it may also be noted that the PPCR scale propounded by Seung and June (2009) indicated several inconsistencies regarding its applicability with respect to online purchase of white goods, brown goods, and consumer electronics. These inconsistencies were noticed as regards the existing parameters of this PPCR scale. As such, there was a need to add new parameters and also modify existing parameters in the PPCR scale due to the dynamic nature of business environment relating to the said types of goods. This was attempted in the present study. This study would thereby help to attain greater knowledge about consumers' perception regarding their levels of post-purchase regret relating to online purchase of such goods. Also, this study will help in the identification of specific group of such consumers who require higher focus in order to minimize chances of PPCR with respect to their age, occupation, monthly income, educational qualification and marital status.
Objective
The objectives of this study are:
- To find through qualitative research the dimensions of PPCR, and thereby develop an appropriate scale for measuring PPCR in case of online purchase of white goods, brown goods, and consumer electronics.
- To identify specific groups of consumers who require special attention for reduction of PPCR on part of the marketers of aforementioned categories of goods.
Data and Methodology
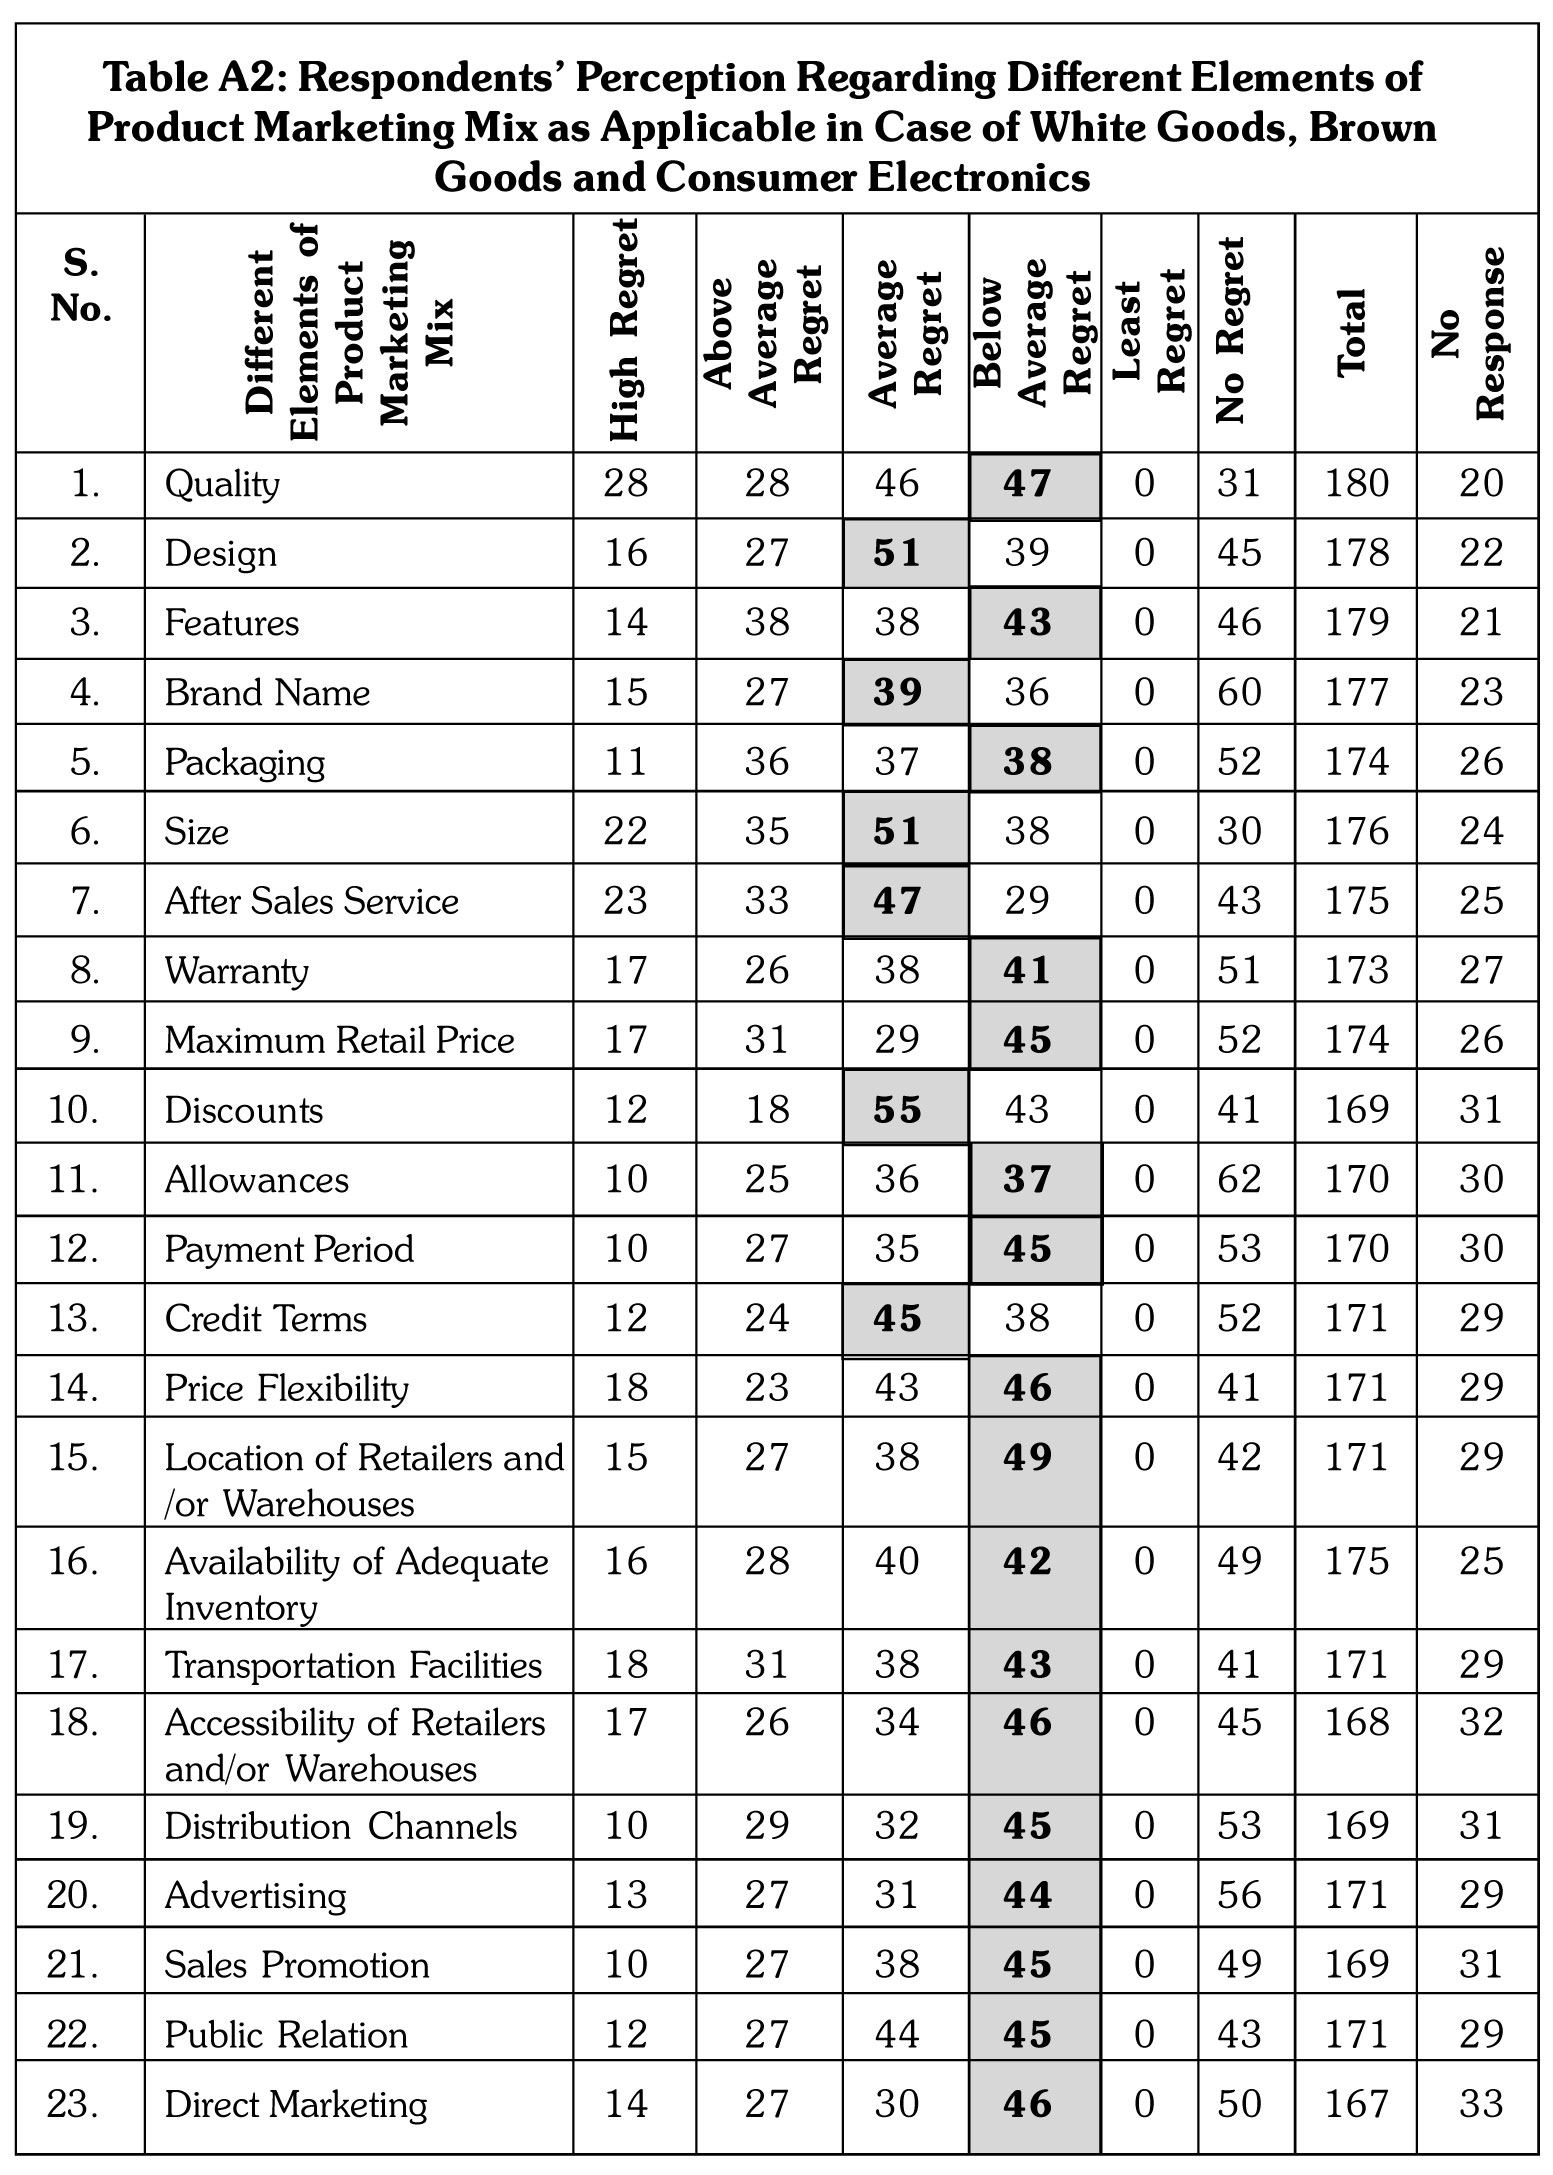
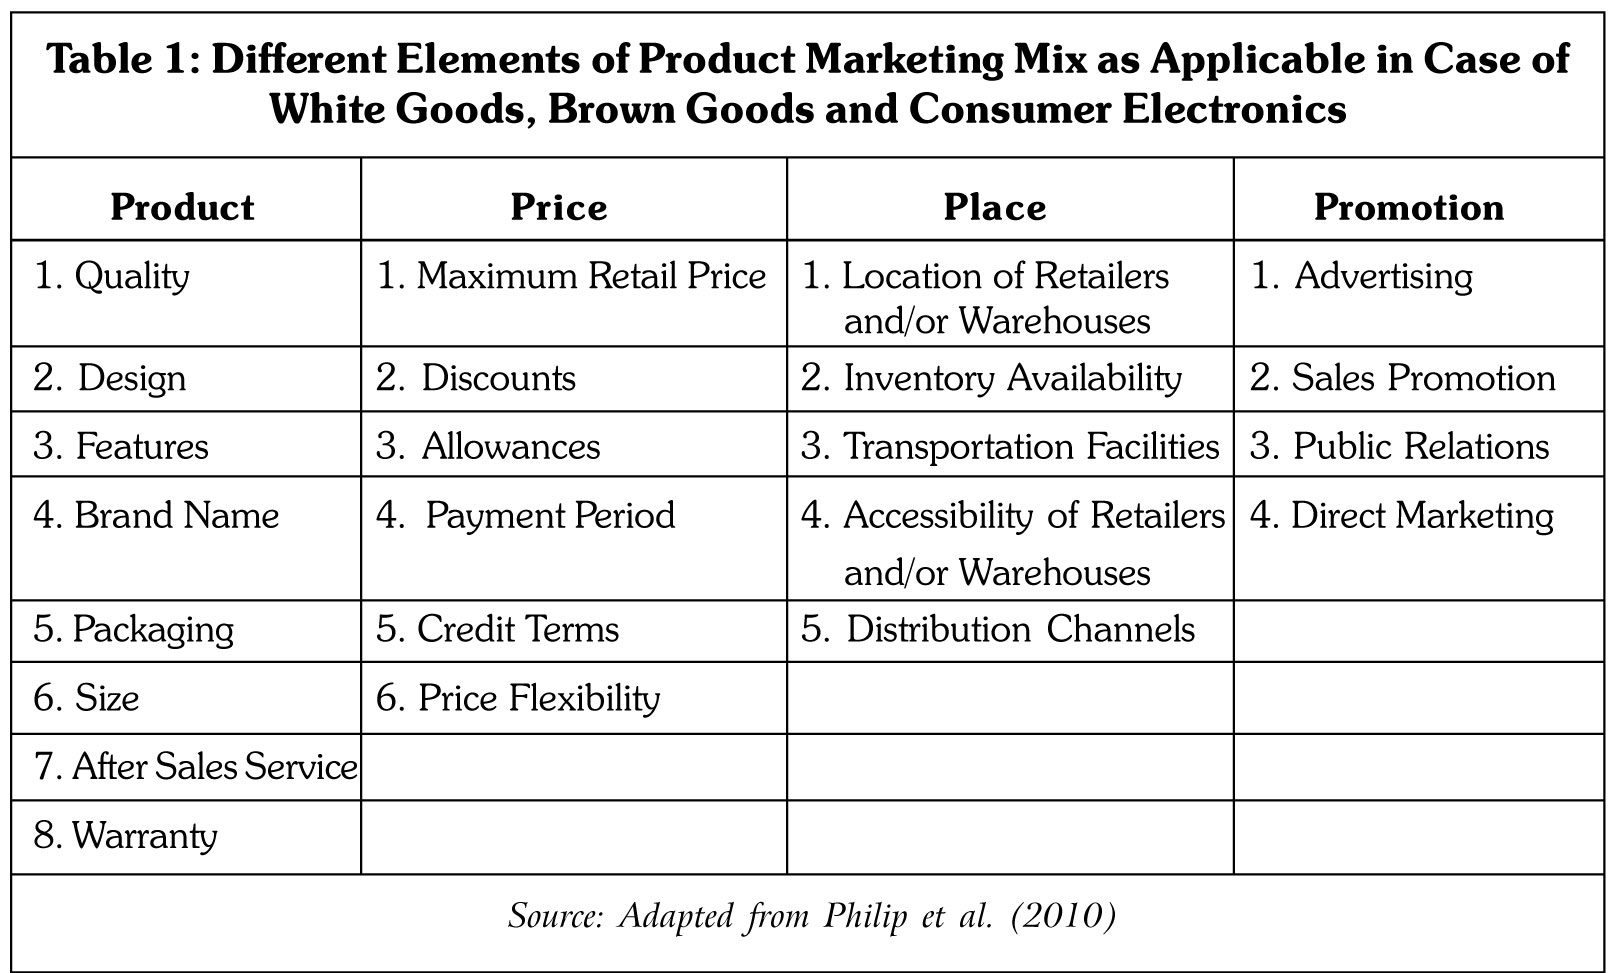
This study was carried out to attain its stated objectives. For fulfilment of the first objective of this study, required data was initially collected through study of relevant literature related to consumer behavior, PPCR, and other related areas of marketing management. In addition, the study also tried to find the various parameters of PPCR in the above endeavor. Thereby, it tried to develop a viable PPCR scale to measure respondents' perception regarding their levels of post-purchase regret with respect to regret characteristics falling under outcome and process regret relating to online purchase of white goods, brown goods and consumer electronics. This was attempted to be accomplished by modifying existing regret parameters, and adding newer such parameters to the existing PPCR scale as propounded by Seung and June (2009) in order to render it applicable for online purchase of the three categories of goods. For this purpose, the findings obtained through a survey (carried out involving a questionnaire administered among 200 respondents) were also taken into account. The respondents were selected from the study population using snowball sampling within the state of Assam in North-East India in a time frame of four months (from September, 2019, to January, 2020). The questionnaire (see Appendix) involved questions for finding out demographic characteristics of the respondents like gender, marital status, age, occupation, monthly income, and educational qualification. Another set of questions measured respondents' perception regarding their levels of post-purchase regret with respect to 23 elements of product marketing mix as shown in Table 1. This was done with the help of a six-point scale ranging from "High regret" to "Above Average regret", "Average regret", "Below Average regret", "Least regret", and "No regret".
Thereafter, there was another scale to measure respondents' perception regarding their levels of PPCR with respect to regret characteristics falling under outcome and process regret. This was done with the help of a similar six-point scale. Next, for validation of the above developed PPCR scale (comprising the above identified parameters)
with respect to white goods, brown goods and consumer electronics, Confirmatory Factor Analysis (CFA) was conducted with the help of AMOS software. Here, Composite Reliability (CR), average variance extracted (AVE) (for assessing convergent validity), and individual item (parameter) loadings of identified common factors (i.e., types of PPCR (as explained in the Results section) were noted (Joseph et al., 2006; and Naresh and Satyabhushan, 2019). Also, the study tried to examine whether the above data fitted relatively well with the help of CMIN/DF, Normed Fit Index (NFI), Comparative Fit Index (CFI), and Root Mean Square Error of Approximation (RMSEA) values. As mentioned earlier, this present study involved use (with some revisions as explained earlier in this section) of different parameters (items) falling under various types of PPCR as per the PPCR scale developed by Seung and June (2009). In the latter study, these various parameters under the above types of the aforesaid regret were already identified and validated empirically. Therefore, Exploratory Factor Analysis (EFA) was not conducted in the present study as it was completely meaningless to do so (Joseph
et al., 2006; David et al, 2016; and Naresh and Satyabhushan, 2019). Besides, a sample size of two hundred respondents was completely appropriate in this case as per views of Naresh and Satyabhushan (2019), and Joseph et al. (2006).
Thereafter, it tried to identify respondents based on their gender who required special emphasis on the part of marketers of white goods, brown goods and consumer electronics with respect to minimization of PPCR. This was attempted through a series of One-way Analysis of Variance (ANOVA) tests carried out with the help of SPSS software. For this purpose, their gender was taken as the independent variable and their perception regarding their levels of PPCR regarding the different product marketing elements of the aforementioned goods (refer to Table 1) was taken as the dependent variable. One-way ANOVA was used to examine the presence of significant differences among the means of the above dependent variable with respect to various groups of the aforesaid independent variable (Deepak and Neena, 2011; David et al., 2016; Donald et al., 2019; and Naresh and Satyabhushan, 2019). Initially, in the above case, One-way ANOVA was used to identify elements from Table 1 in case of which the aforementioned means differed significantly with respect to different groups of respondents' gender (i.e., dependent variable) (p-value less than a = 0.05 (5%)). Next, from descriptive statistics, it was attempted to find the value of the above means (relating to the above identified elements) which was highest in comparison to the other means and the corresponding group relating to respondents' gender. The latter identified group (of respondent's gender) require higher attention from marketers of the aforesaid types of goods in order to minimize PPCR. Similarly, One-way ANOVA was used to find out the specific group of respondents that needed higher focus in order to minimize the aforementioned PPCR with respect to their age, occupation, monthly income, and educational qualification. Likewise, Independent Sample t-test was employed using SPSS software to spot respondents based on their marital status who required exceptional emphasis on the part of marketers of the three categories of goods in order to minimize PPCR (Deepak and Neena, 2011; David et al., 2016; Donald et al., 2019; and Naresh and Satyabhushan, 2019). As such, their marital status was taken as the independent variable and their perception regarding their levels of PPCR regarding the above marketing mix elements of the goods (falling under product marketing mix as shown in Table 1) were taken as the dependent (test) variable. It is to be noted that t-test had to be used in this case as the independent variable consisted of only two groups. Here, t-test was utilized to check the presence of significant differences between the means of the dependent variable with respect to various groups of the independent variable. Here too, firstly, t-test was used to find the elements from Table 1 in case of which the aforesaid means differed significantly with respect to different groups of respondents' marital status (i.e., dependent variable)
(p-value less than a = 0.05 (5%)). Then, from descriptive statistics, the study tried to find the value of the above mean (relating to the identified elements) which was higher in comparison to the other mean and the corresponding group with respect to respondents' marital status. The latter identified group (of respondent's marital status) require higher consideration from marketers of white goods, brown goods and consumer electronics so as to reduce PPCR.
As explained earlier, one-way ANOVA and independent sample t-test were also used to identify respondent groups based on their gender, marital status, age, occupation, monthly income, and educational qualification with respect to their perception regarding different levels of various parameters of the revised PPCR scale applicable for white goods, brown goods, and consumer electronics. Therefore, through the above processes, the study tried to find out the respondent groups (based on the demographic variables) who needed higher emphasis from marketers of such goods for reducing PPCR.
Results
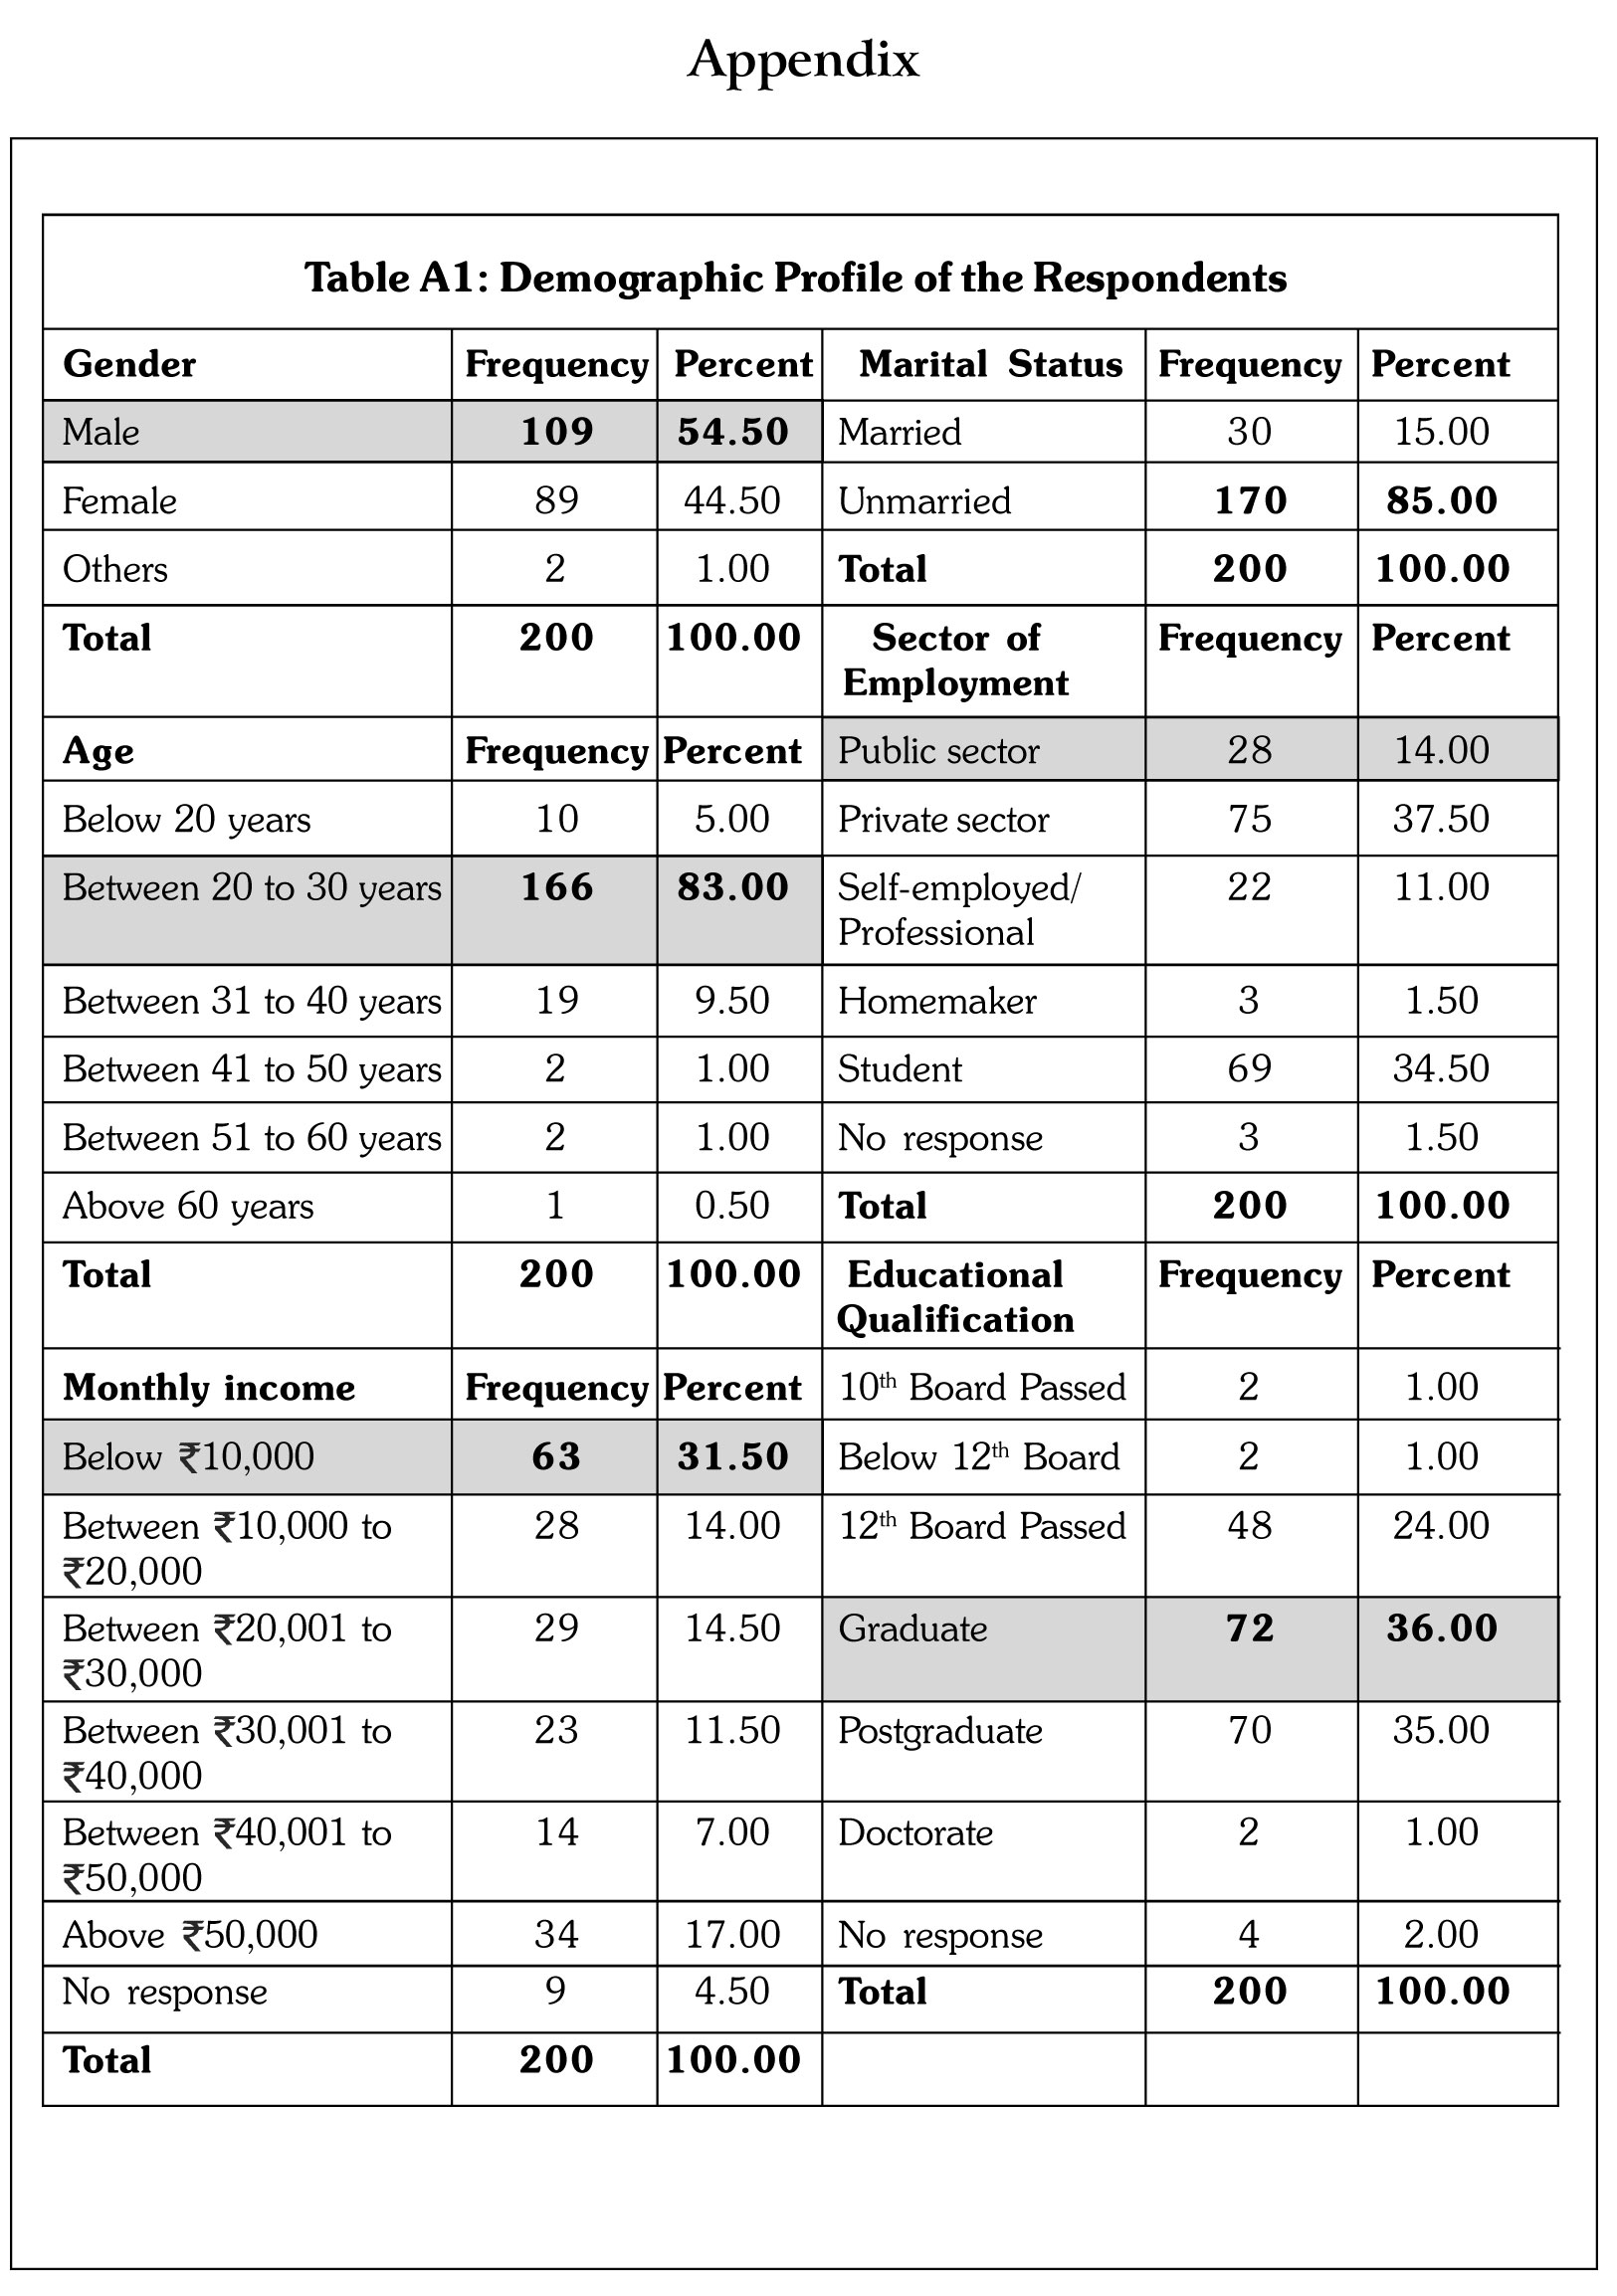
Demographic Characteristics of the Respondents: Findings of this study indicated that most of the respondents were males (54.90%), unmarried (85.00%), and between 20 to 30 years in age (83.00%) (refer to Table A1 in Appendix). It was also noticed that most of them were working in the private sector (37.50%), were graduates (36.00%), and with a monthly income below 10,000 (31.50%).
Post-Purchase Regret (PPCR) Scale: Decision justification theory suggested that individuals can regret due to evaluation of the outcomes and evaluation of the process (Terry and Marcel, 2002). Seung and June (2009) stated that these two dimensions are themselves multidimensional, and that the total regret experienced by a consumer is a sum of four components which can be categorized under outcome regret and process regret.
Outcome Regret
Regret Due to Foregone Alternatives: It is experienced when individuals consider the chosen alternative to be substandard compared to the foregone alternative(s). Conventionally, researchers believed that outcomes of the rejected alternative must be known to the buyer in order to feel regret (David, 1982). However, Ilana and Jonathan (1995) stated that the foregone alternatives can be imagined or hypothetically imagined by consumers.
Regret Due to a Change in Significance: It is experienced when individual's perception of the product utility reduces from the time of purchase to a point of time after the purchase (Seung and June, 2009).
Process Regret
Regret Due to Under-Consideration: Individuals regret if they feel they have failed to execute the decision process as they intended. This indicates an intention-behavior inconsistency (Rik and Marcel, 2005). Individuals can also feel regret if they believe that they lacked the desired quality and/or quantity of information to make a good decision (Seung and June, 2009).
Regret Due to Over-Consideration: It is experienced when individuals regret putting too much time and effort into the buying process. Besides, it is also experienced when individuals regret about having gathered unnecessary information which might not have factored into the final result (Seung and June, 2009).
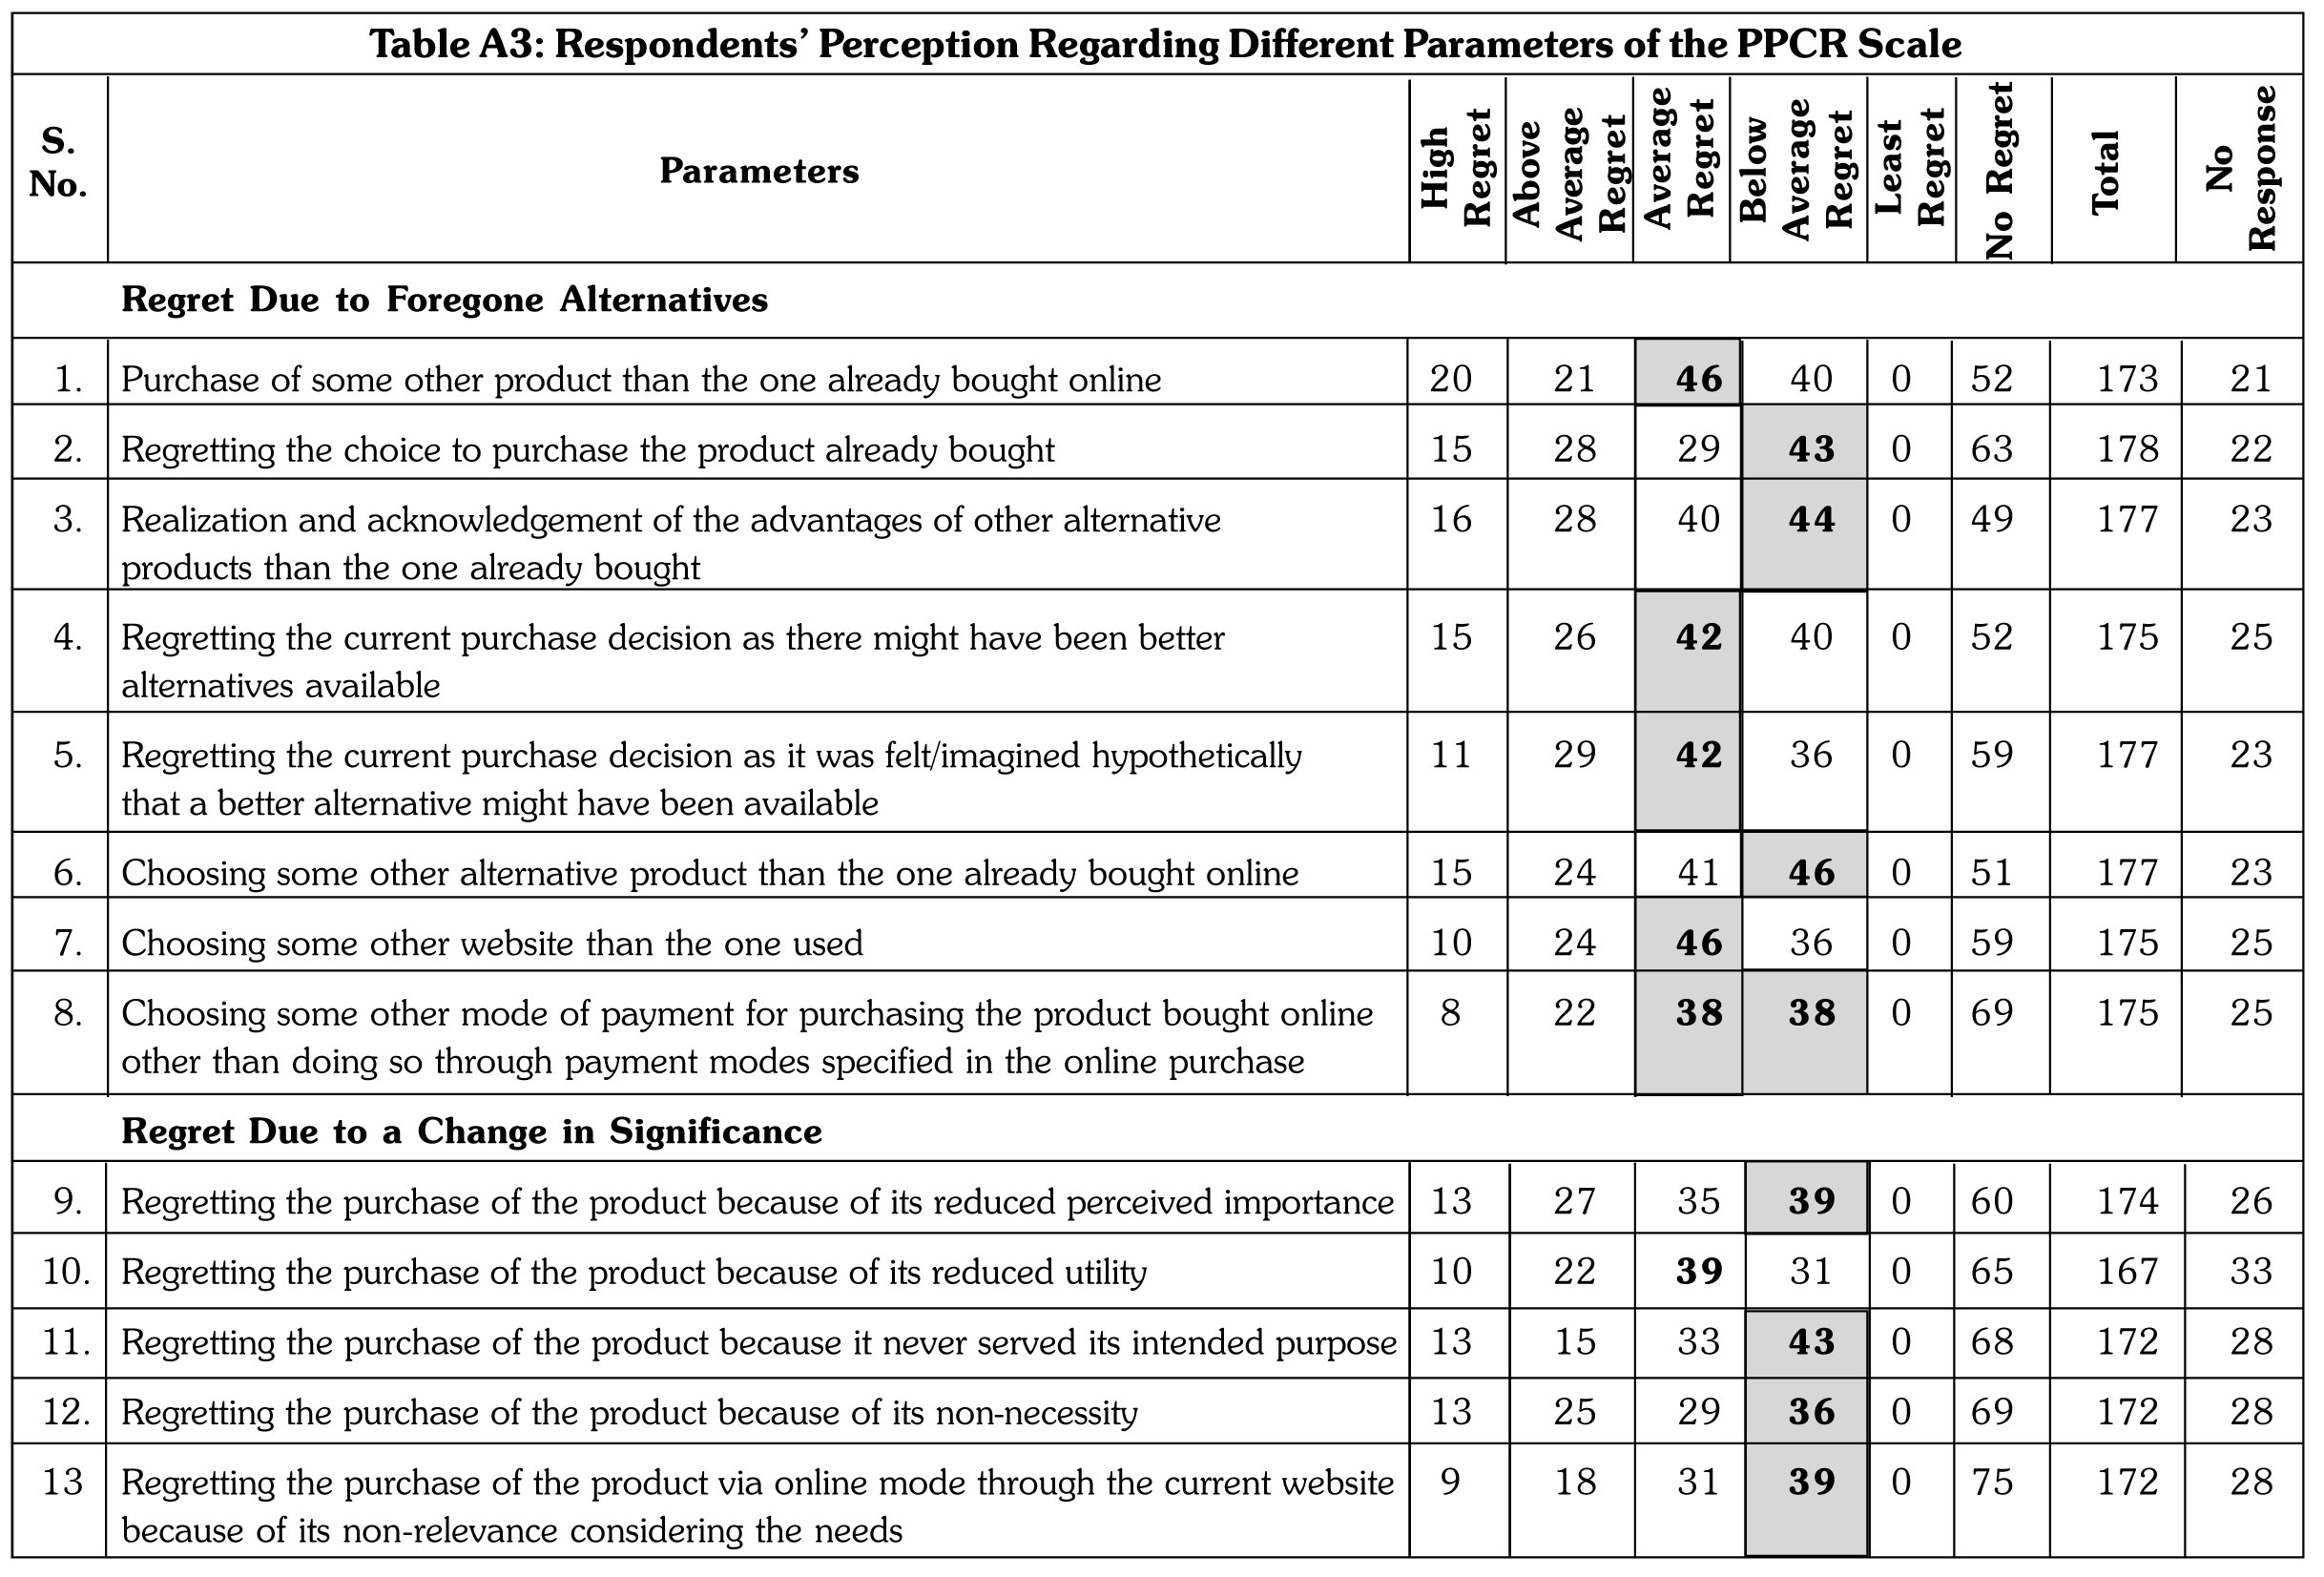
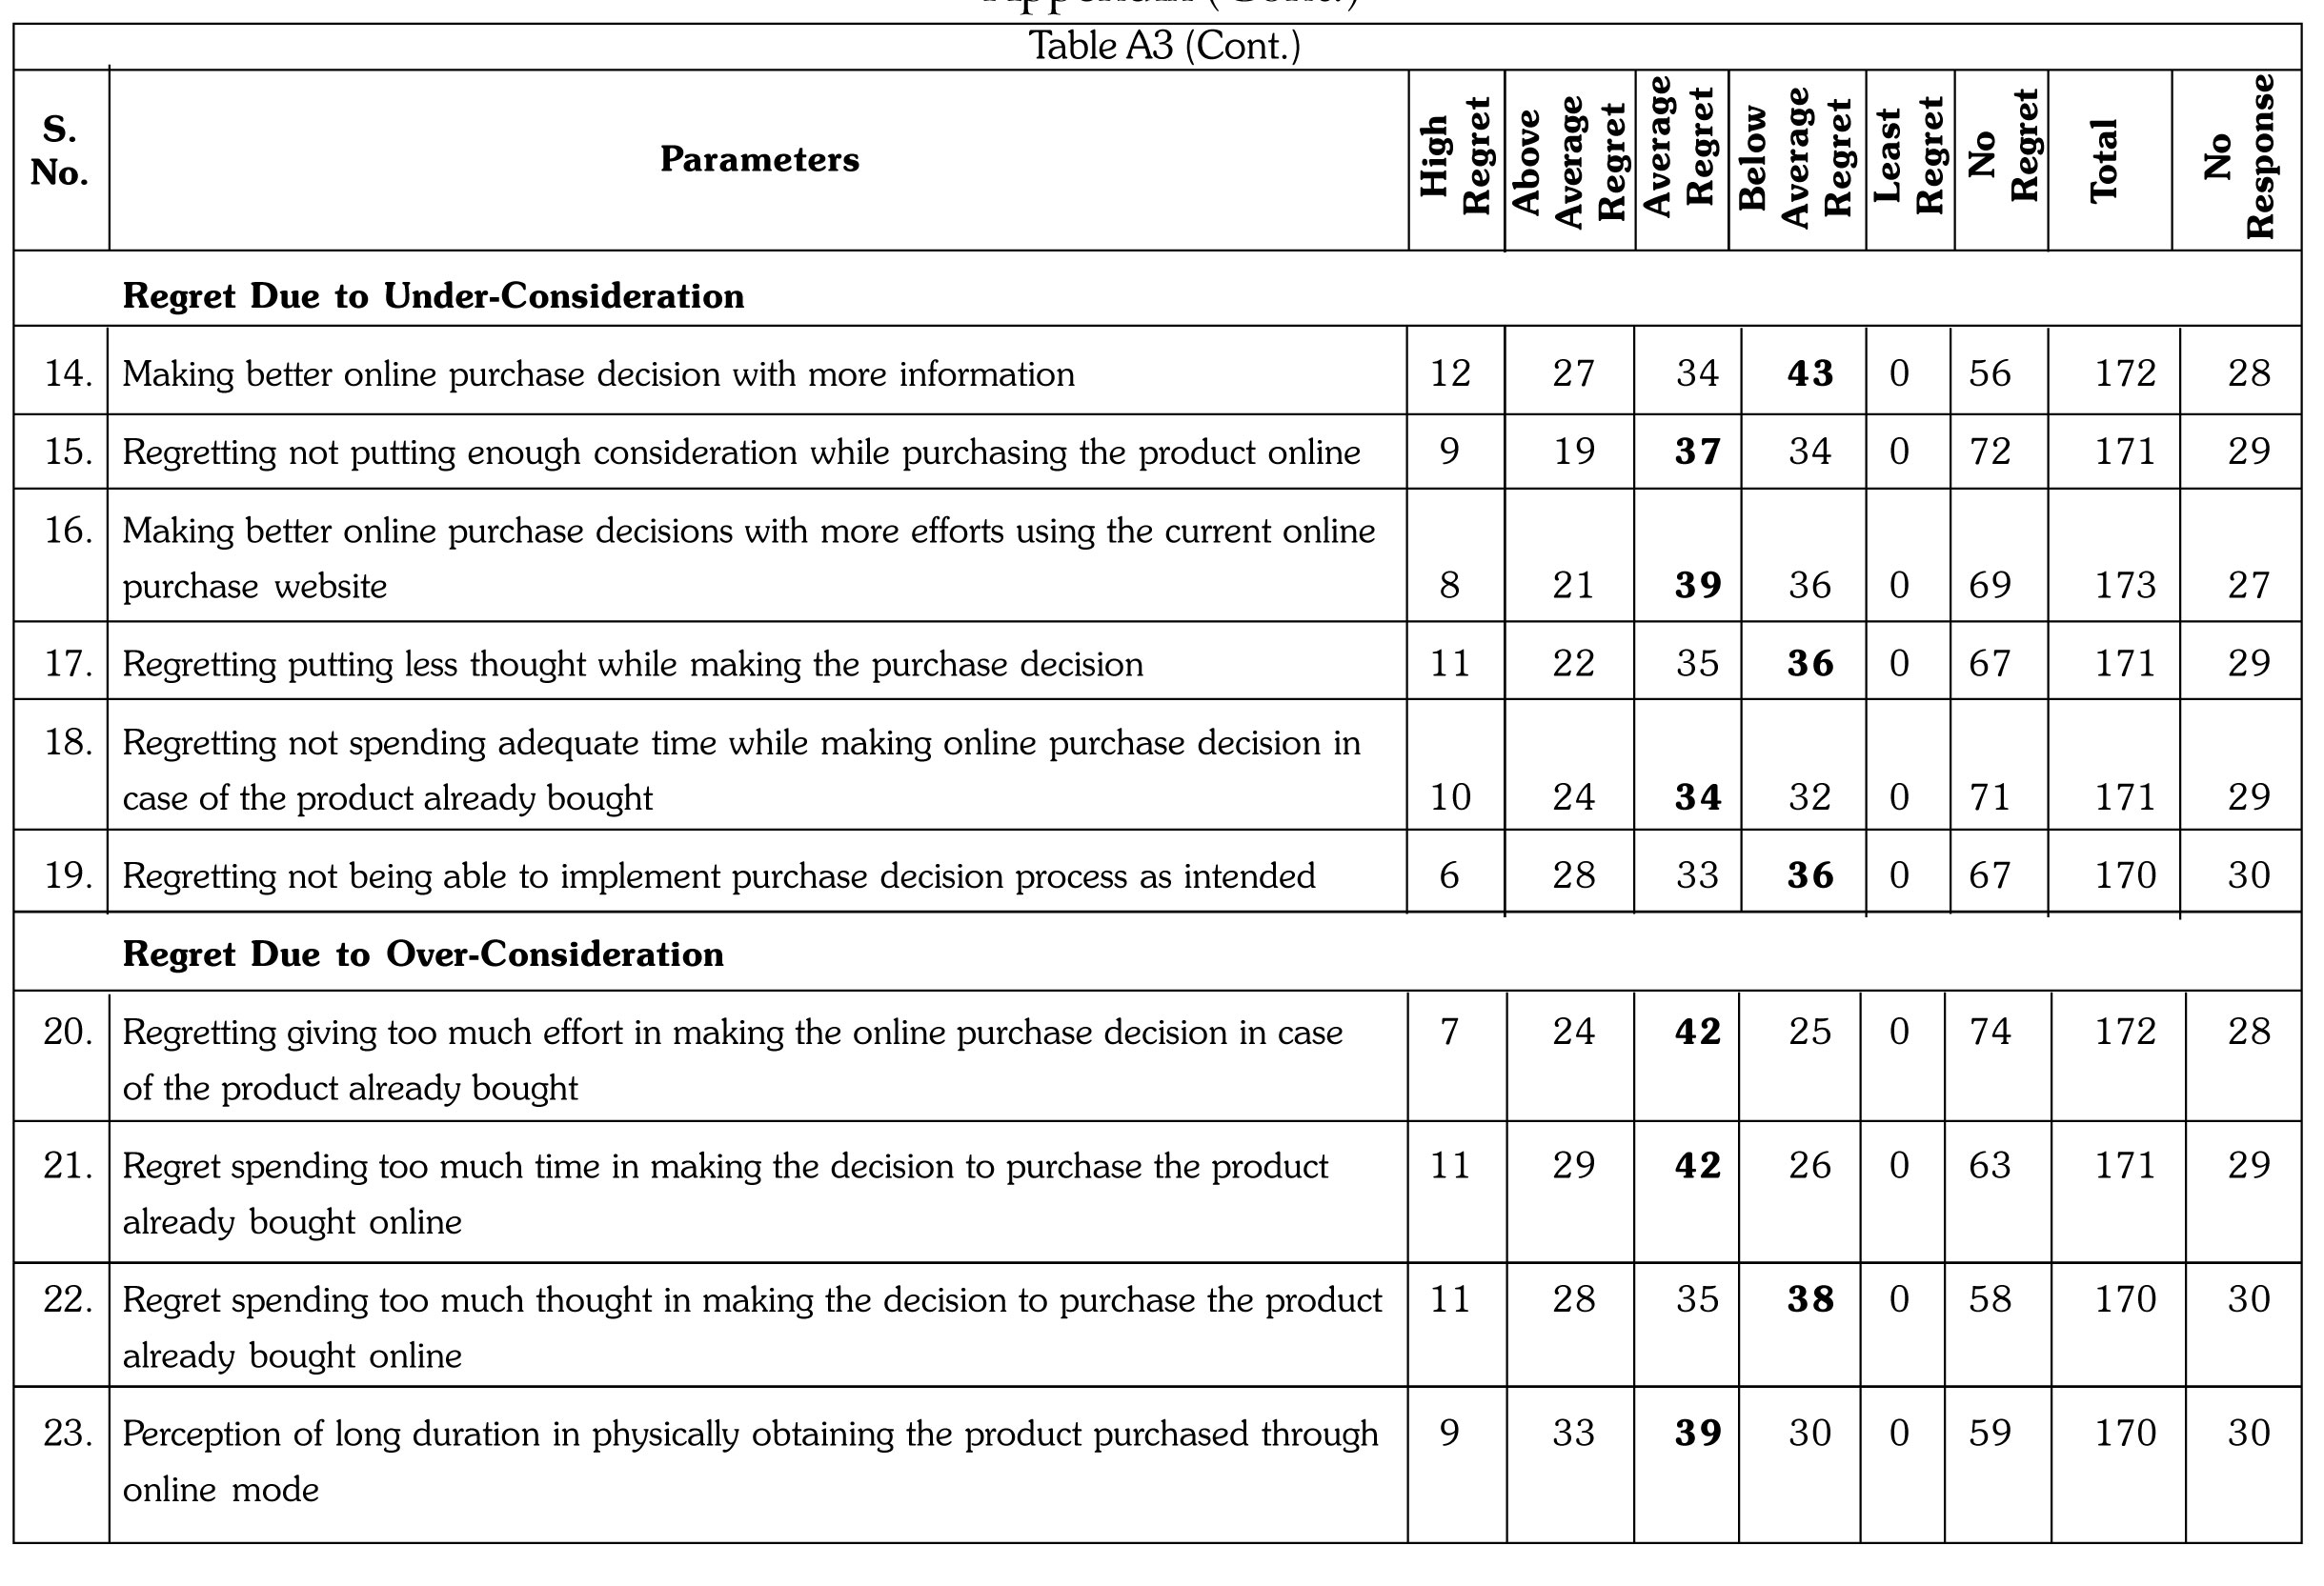
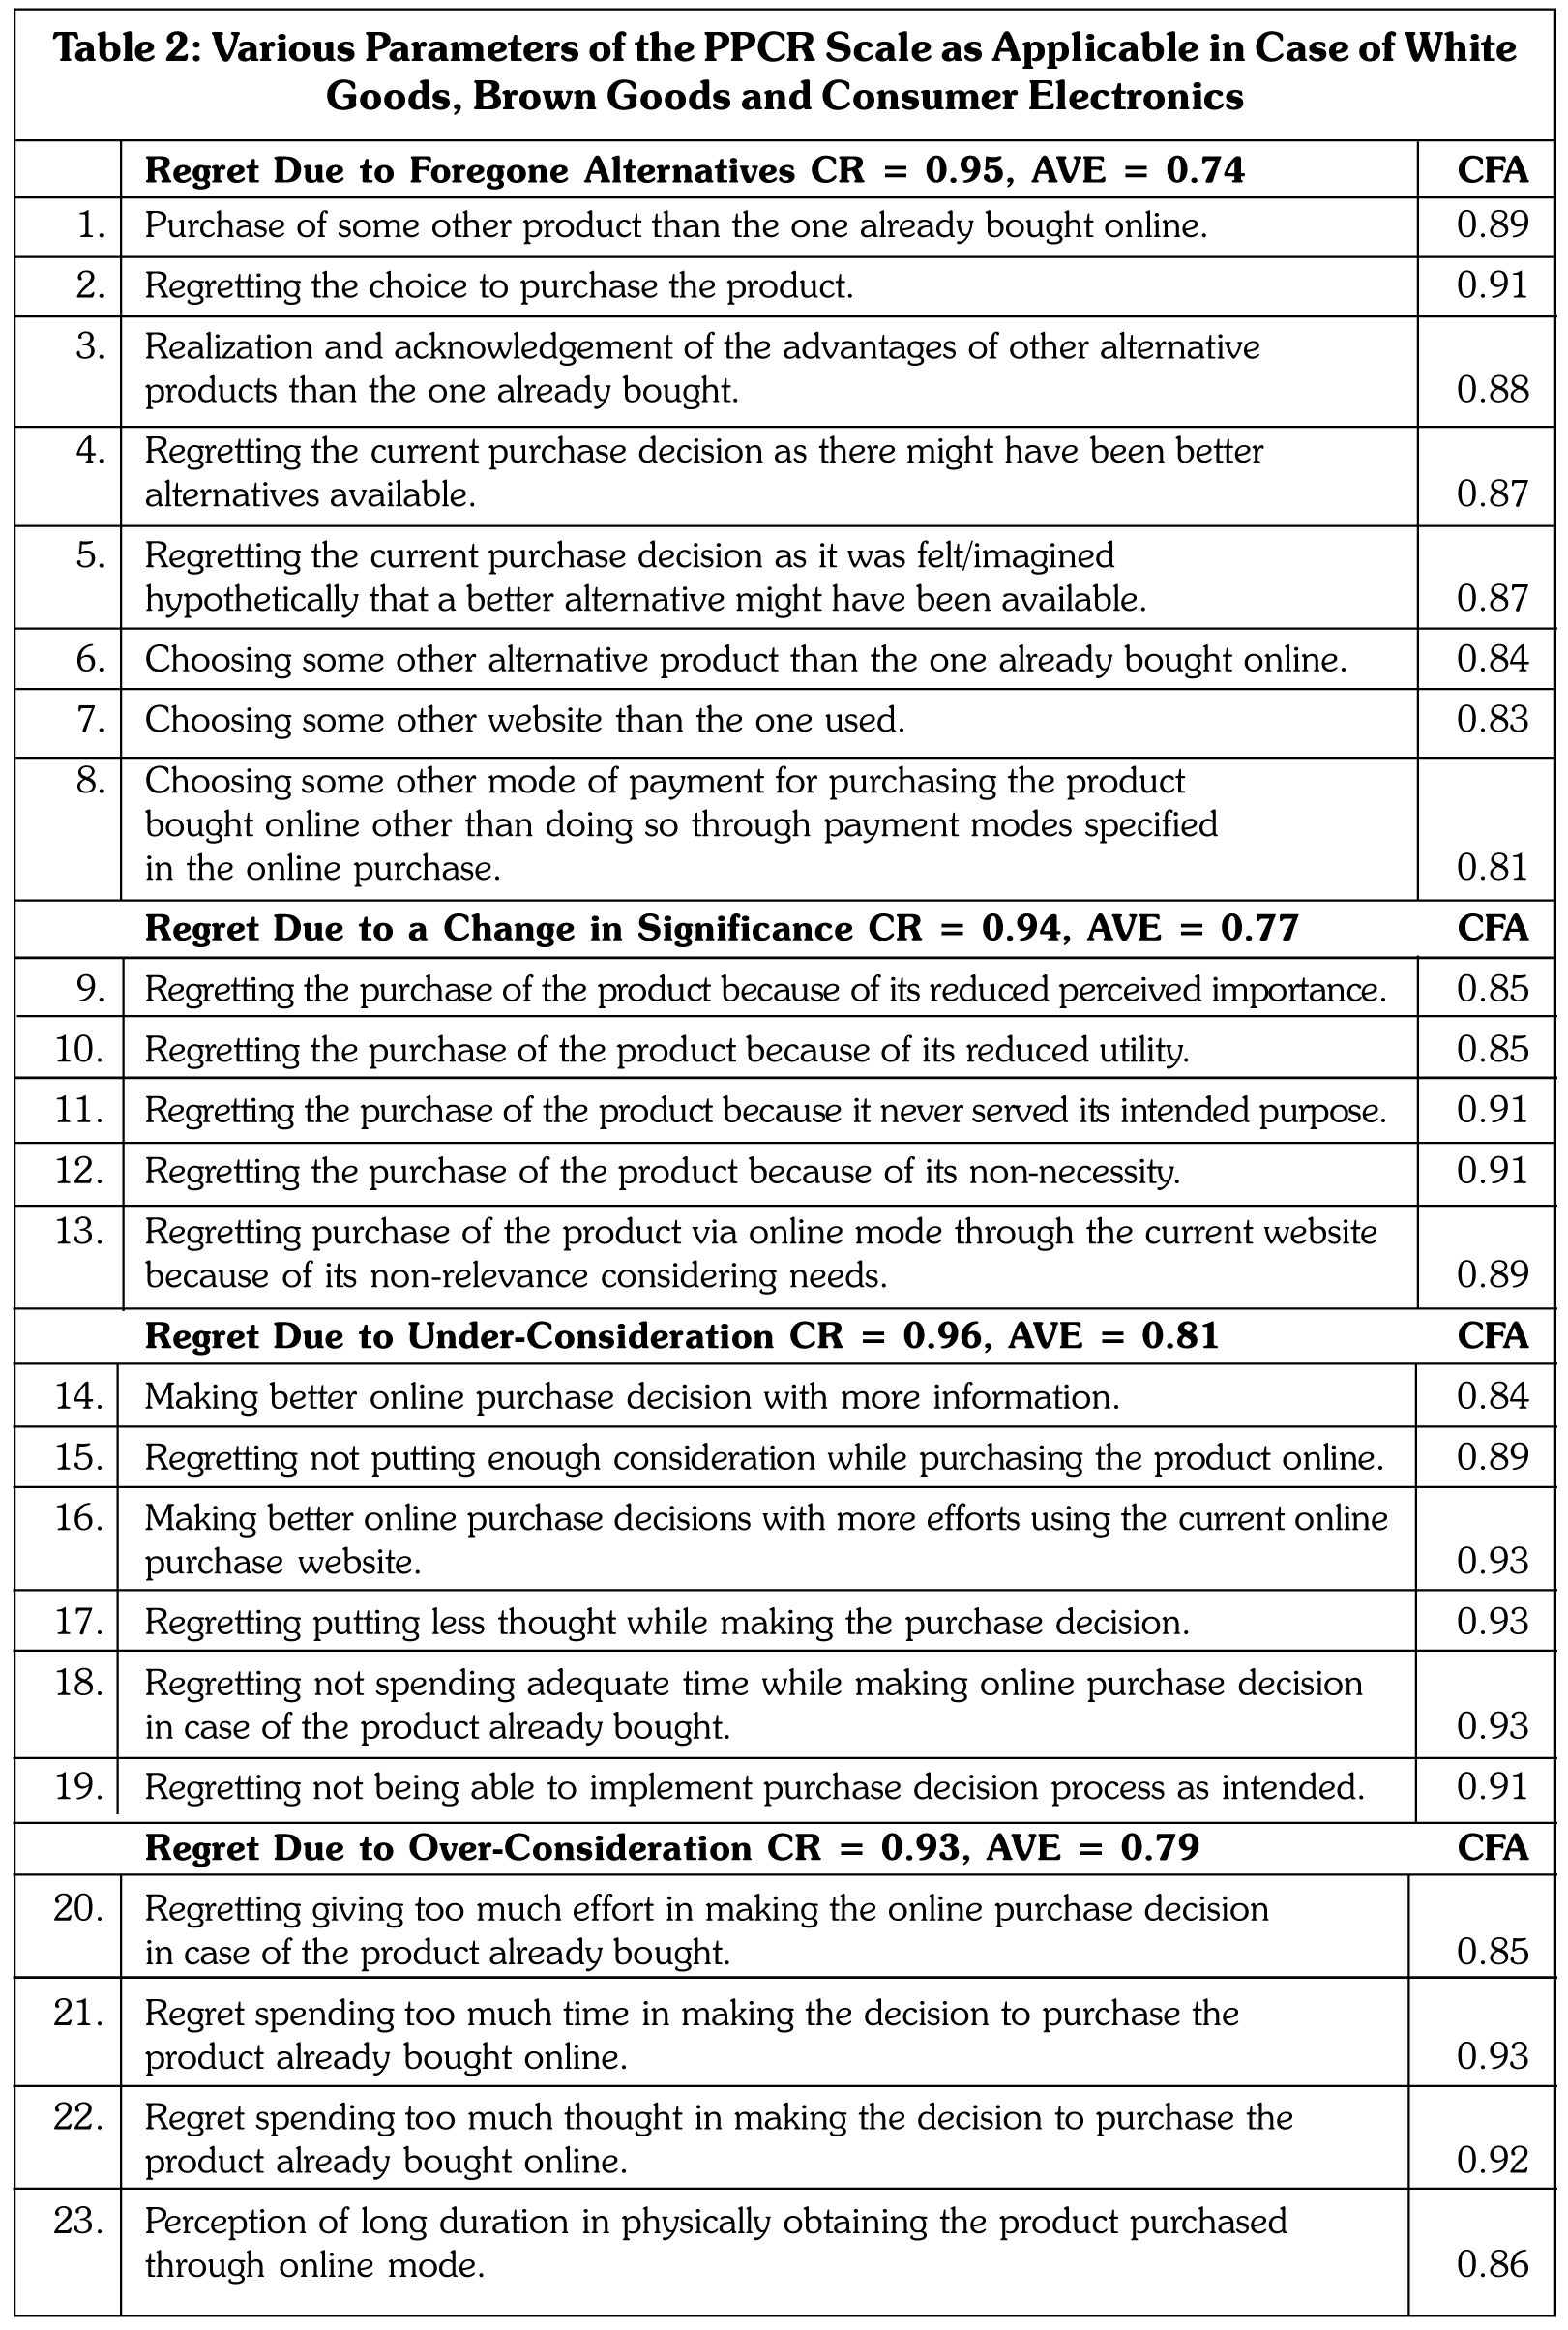
Based on the above observations (and earlier studies), it was seen that there were 23 parameters for the aforementioned PPCR scale as applicable in case of online purchase of white goods, brown goods and consumer electronics which can be categorized under the sub-types of PPCR as shown in Table 2.
The scale has been validated based on CFA of these 23 parameters (refer to the section Methodology). It was also found that the above correlated structure comprising four factors (types of PPCR) as shown in Table 2 fits the data relatively well (CMIN/DF = 6.623, NFI = 0.721, CFI = 0.751, RMSEA = 0.168). It is to be noted that CMIN indicates Chi-Square Statistic (c2) which is the minimum value of discrepancy (Joseph et al. 2006; and Daire et al., 2008). However, the value of CMIN/DF in the above case may be ignored for the following limitations of Chi-Square (c2) Statistic (indicated by CMIN):
- c2 Statistic is sensitive to sample size. Whenever large sample size is used, it tends to reject any model in most cases even when such a model is adequately specified (Peter and Douglas, 1980; Joseph et al., 2006; Karl and Dag, 1993). Besides, in case of small samples, it still has a tendency to reject any model in most cases even though such a model is satisfactorily specified (David and Betsy, 2003).
- c2 Statistic is based on the assumption of normality. Any deviation of any given data set from normality may result in rejection of any model even though it may be specified properly (Cameron, 2006; and Joseph et al., 2006).
- In addition, Blair et al. (1977) have highlighted the absence of any consensus on an acceptable value of CMIN/DF. This view has been supported by Daire et al. (2008), and Joseph et al. (2006).
Therefore, as per views of Jan-Benedict et al. (1991), Joseph et al. (2006), and Daire et al. (2008), it can be inferred that there exists unidimensionality in the above developed PPCR scale in case of white goods, brown goods and consumer electronics.
Further, Shirang (2014) has broadly segmented consumer durables into home appliances and electronic goods and has further divided home appliances into white goods and brown goods. Also, the report of Care Ratings on Consumer Durables Industry - Structure and Prospects (2018), broadly classified consumer durables under consumer appliances and consumer electronics, and further classified consumer appliances/domestic appliances under 'white goods' and 'brown goods'. Besides, the IBEF Report (2019) divided consumer durables into two categories, namely, consumer electronics (brown goods) and consumer appliances (white goods). As consumer durable goods have been categorized into various segments, therefore, the present paper tries to validate a PPCR scale in case of online purchase taking into consideration all the segments of consumer durables, namely, white goods, brown goods and consumer electronics as proposed in the studies mentioned above. The present paper tries to validate the PPCR scale in case of all the segments of the aforementioned goods as a whole. This is also considering the fact that the above three categories of goods belong to the broad classification of consumer durable goods at large. As such, all the above parameters of the PPCR scale are applicable in case of the three categories of goods. This fact was also observed from interactions with respondents during the survey.
It is to be noted that most respondent consumers' perceived "average" and "below average" PPCR regarding different elements of product marketing mix as applicable in case of the three categories of goods (refer to Table A2 in Appendix). Similar results were also seen in case of their regret regarding different parameters of the PPCR scale shown in Table 2 (refer to Table A3 in Appendix).
Demographic Characteristics and Level of PPCR
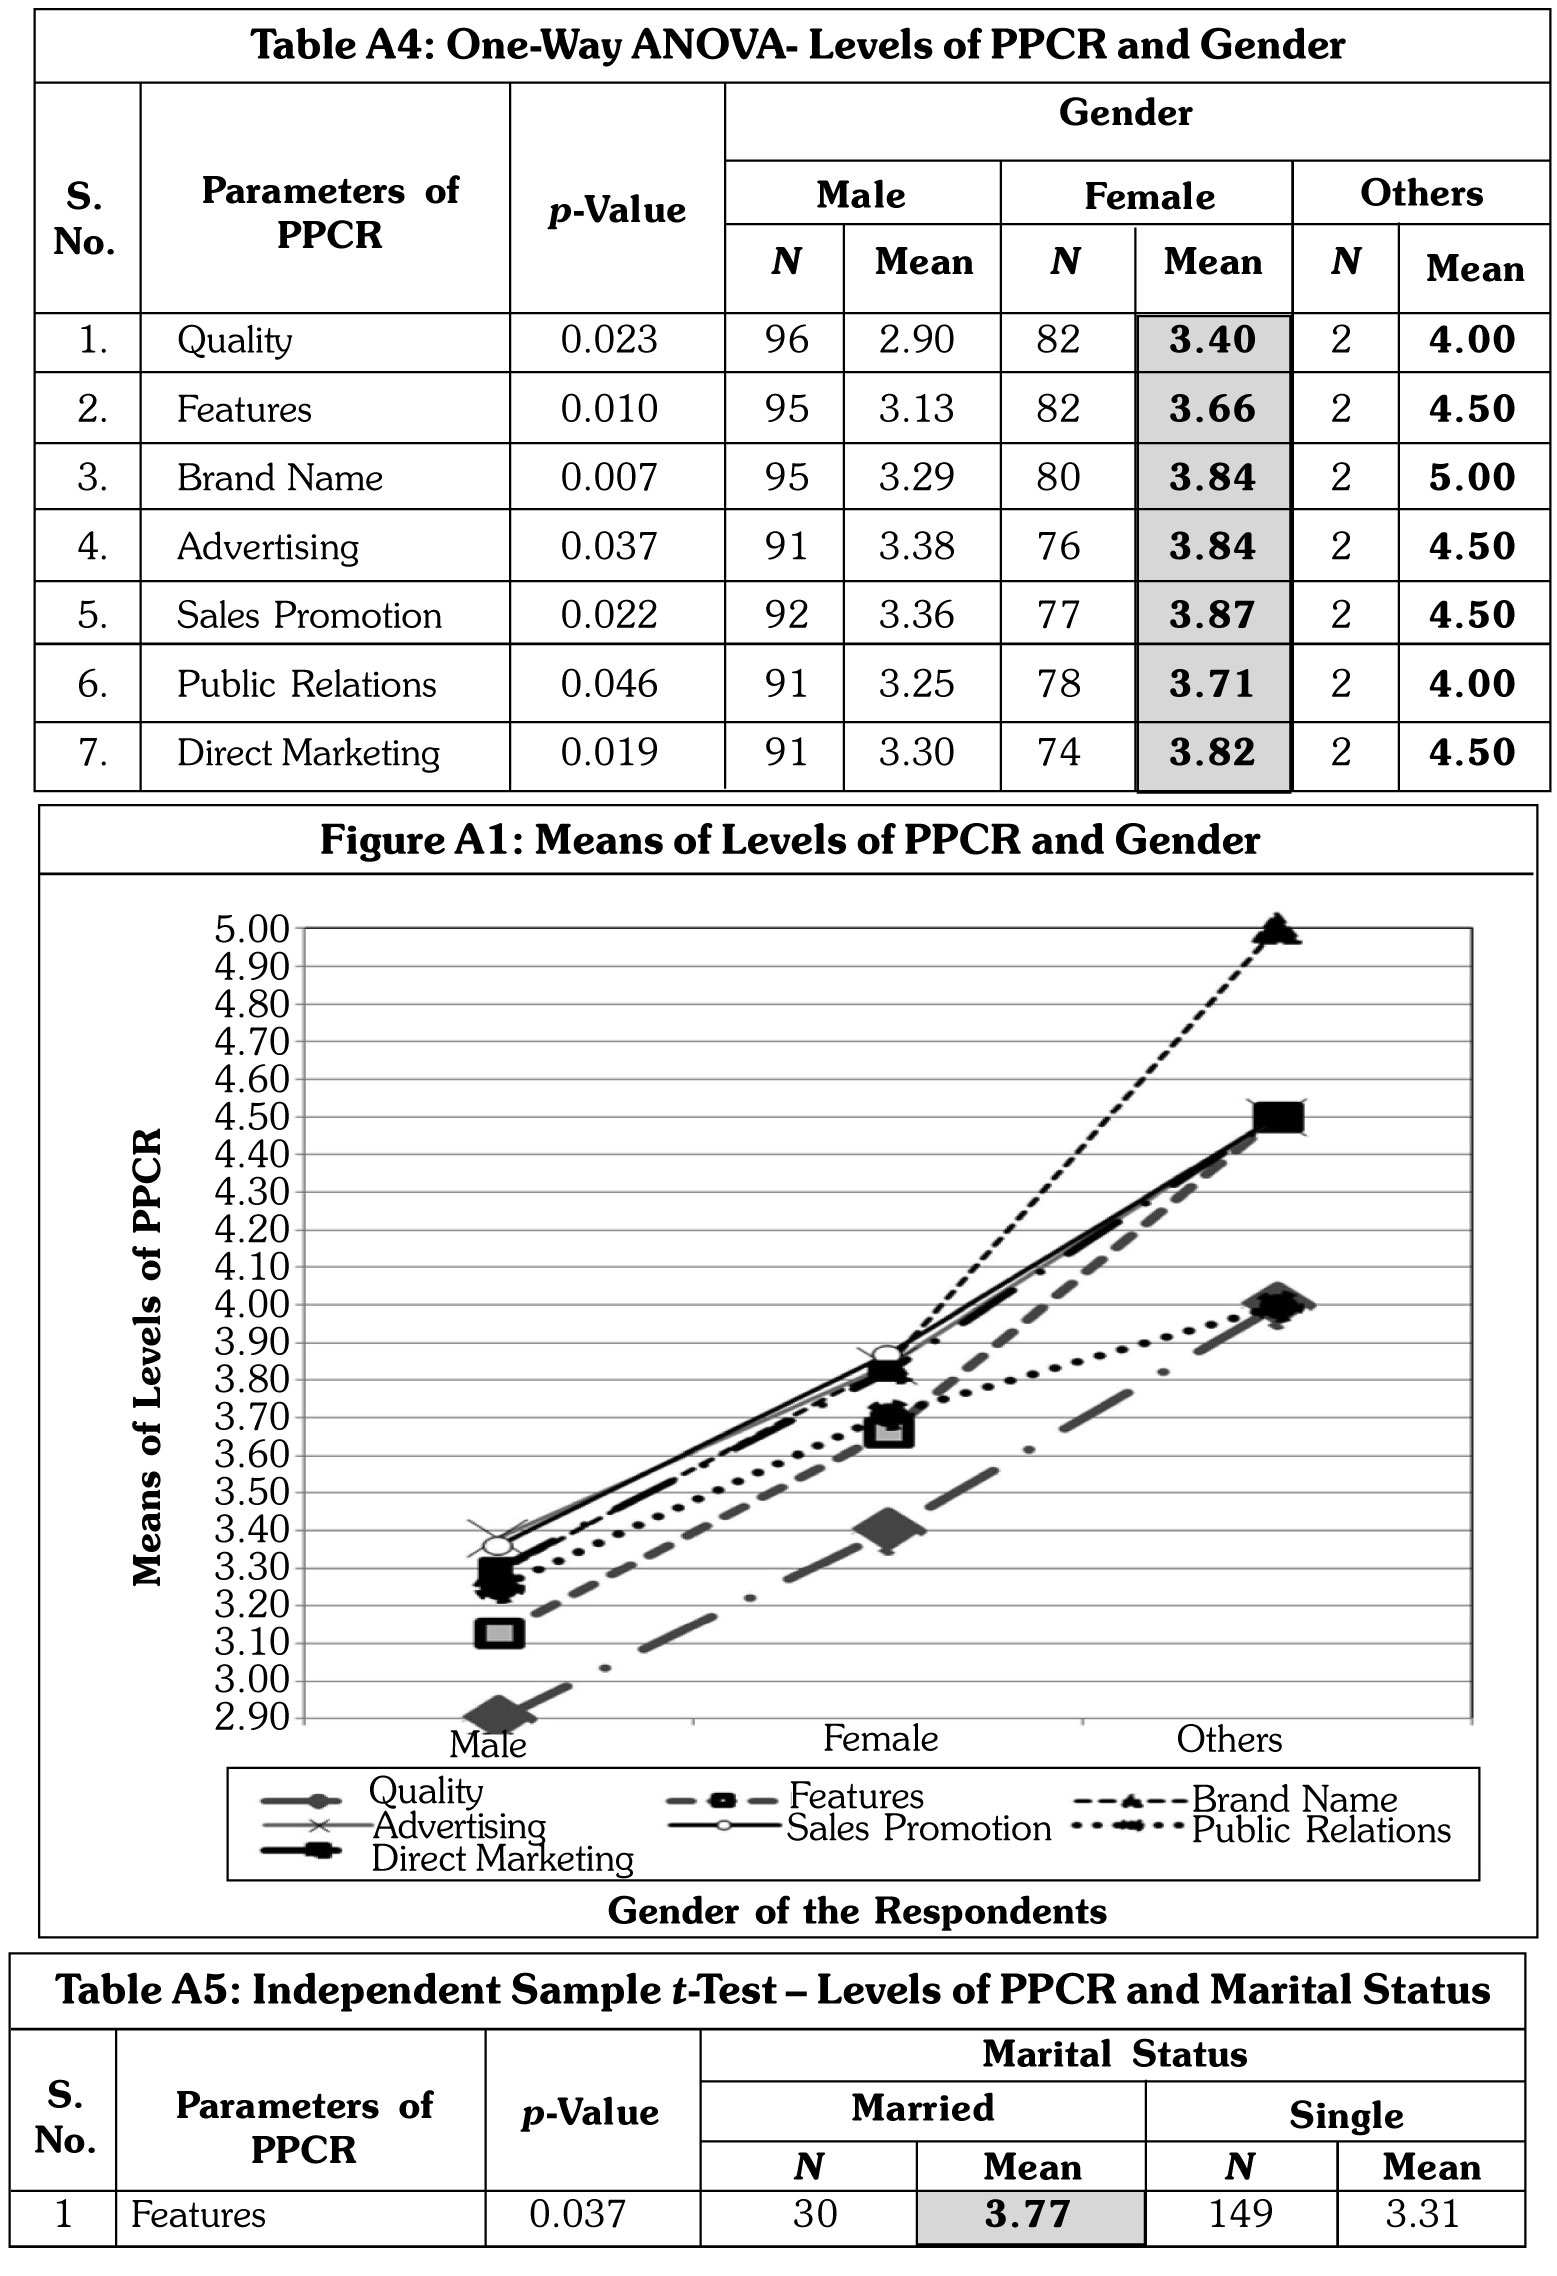
As noted in Methodology section, the study tried to identify respondents based on their gender who required special emphasis on the part of marketers of white goods, brown goods and consumer electronics with respect to minimization of PPCR. One-way ANOVA was used for the purpose. The results of one such test indicated that the null hypothesis that 'there exists no significant differences among the means of respondents' perception regarding their levels of PPCR regarding quality of the goods with respect to different groups of their gender' can be rejected (p-value = 0.023 less than a = 0.05) (refer to Table A4 and Figure A1 in Appendix). This clarifies the existence of significant differences as far as quality of the goods is concerned. It is seen from descriptive data that the mean is highest in case of the third gender in case of quality. However, this fact may not be emphasized as there were only two respondents in this case. Next, it was observed that the second highest mean was found in case of females. So, it may be inferred that marketers of the categories of goods should heavily focus on female consumers so as to reduce PPCR taking quality into account. Similar significant differences were found relating to six other marketing mix elements of the goods as per results of One-way ANOVA, namely, features, brand name, advertising, sales promotion, public relations, and direct marketing. Here too, the results of descriptive statistics were same as noted earlier. This implies that marketers of the goods should focus on female consumers in order to minimize PPCR concerning the six other marketing mix elements of such goods.
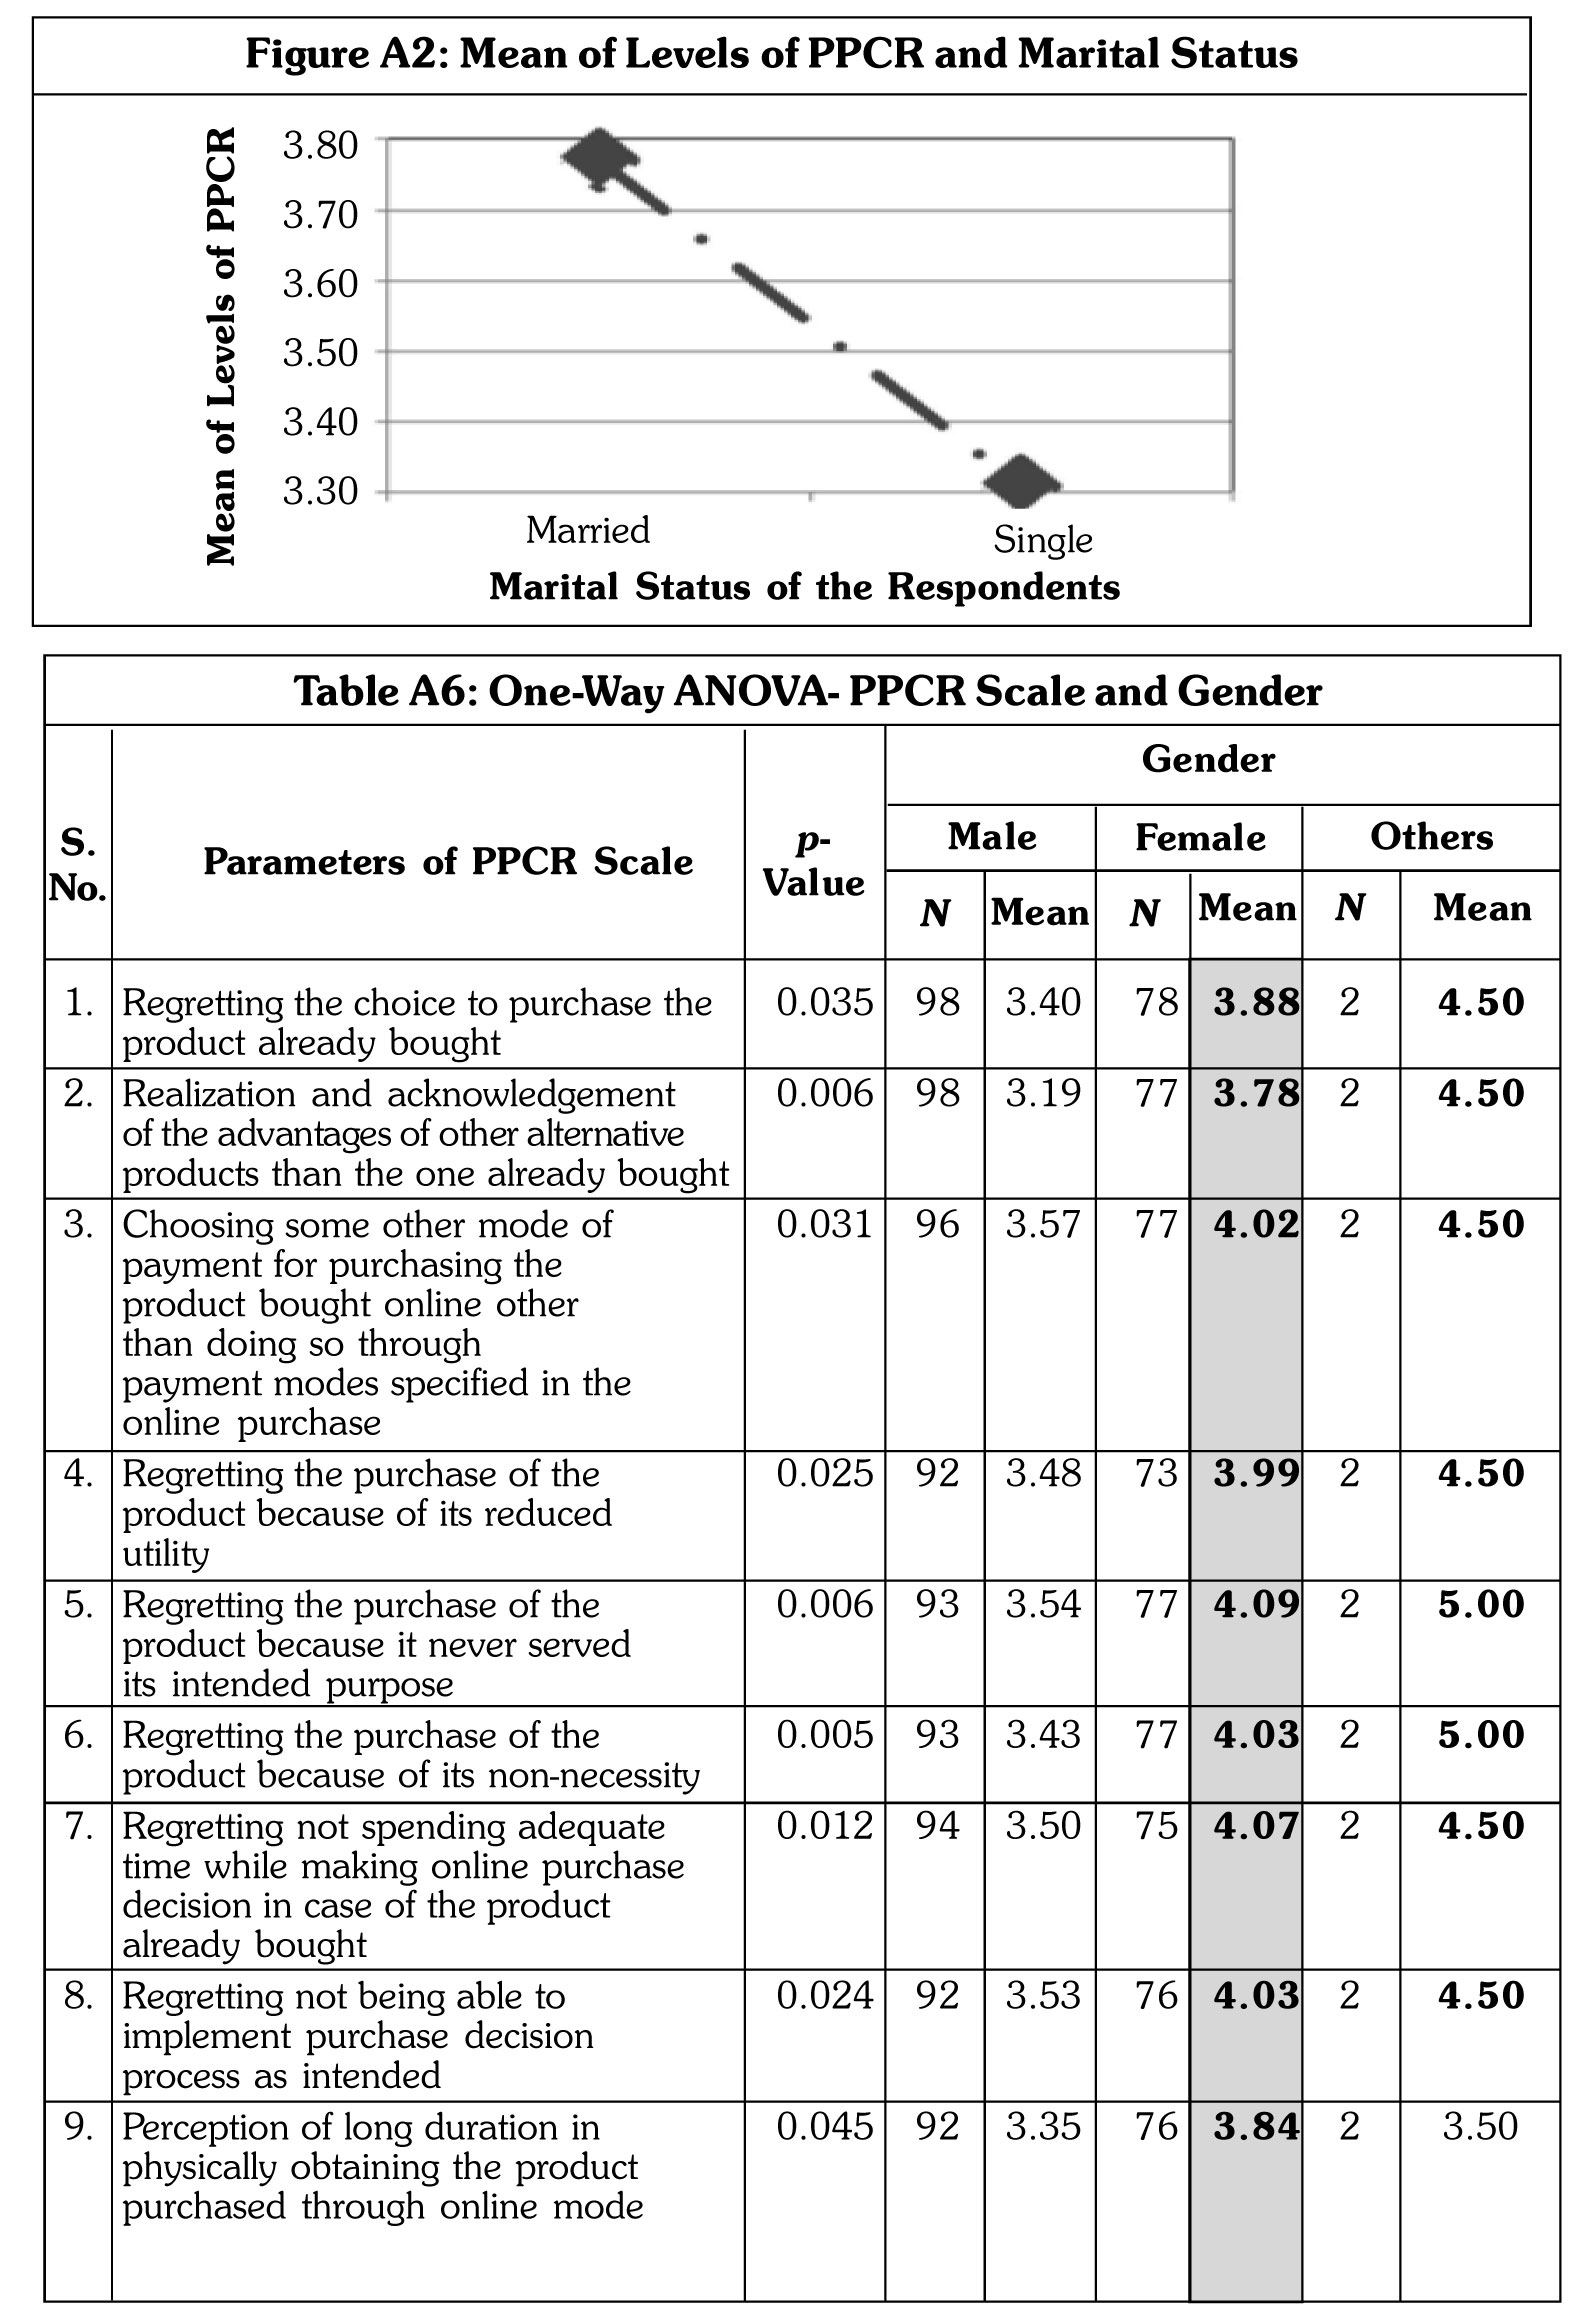
The outcome of independent sample t-test indicated that the null hypothesis that 'there exists no significant difference between the means of respondents' perception regarding their levels of PPCR regarding features of the goods with respect to different groups of their marital status' can be rejected (p-value = 0.037 less than a = 0.05) (refer to Table A5 and Figure A2 in Appendix). This clarifies the existence of significant differences with respect to features of the goods. It is seen from descriptive data that the mean is highest in case of married respondents. Therefore, it may be stated that marketers of the categories of goods should heavily focus on married consumers for reduction of PPCR considering features of such goods.
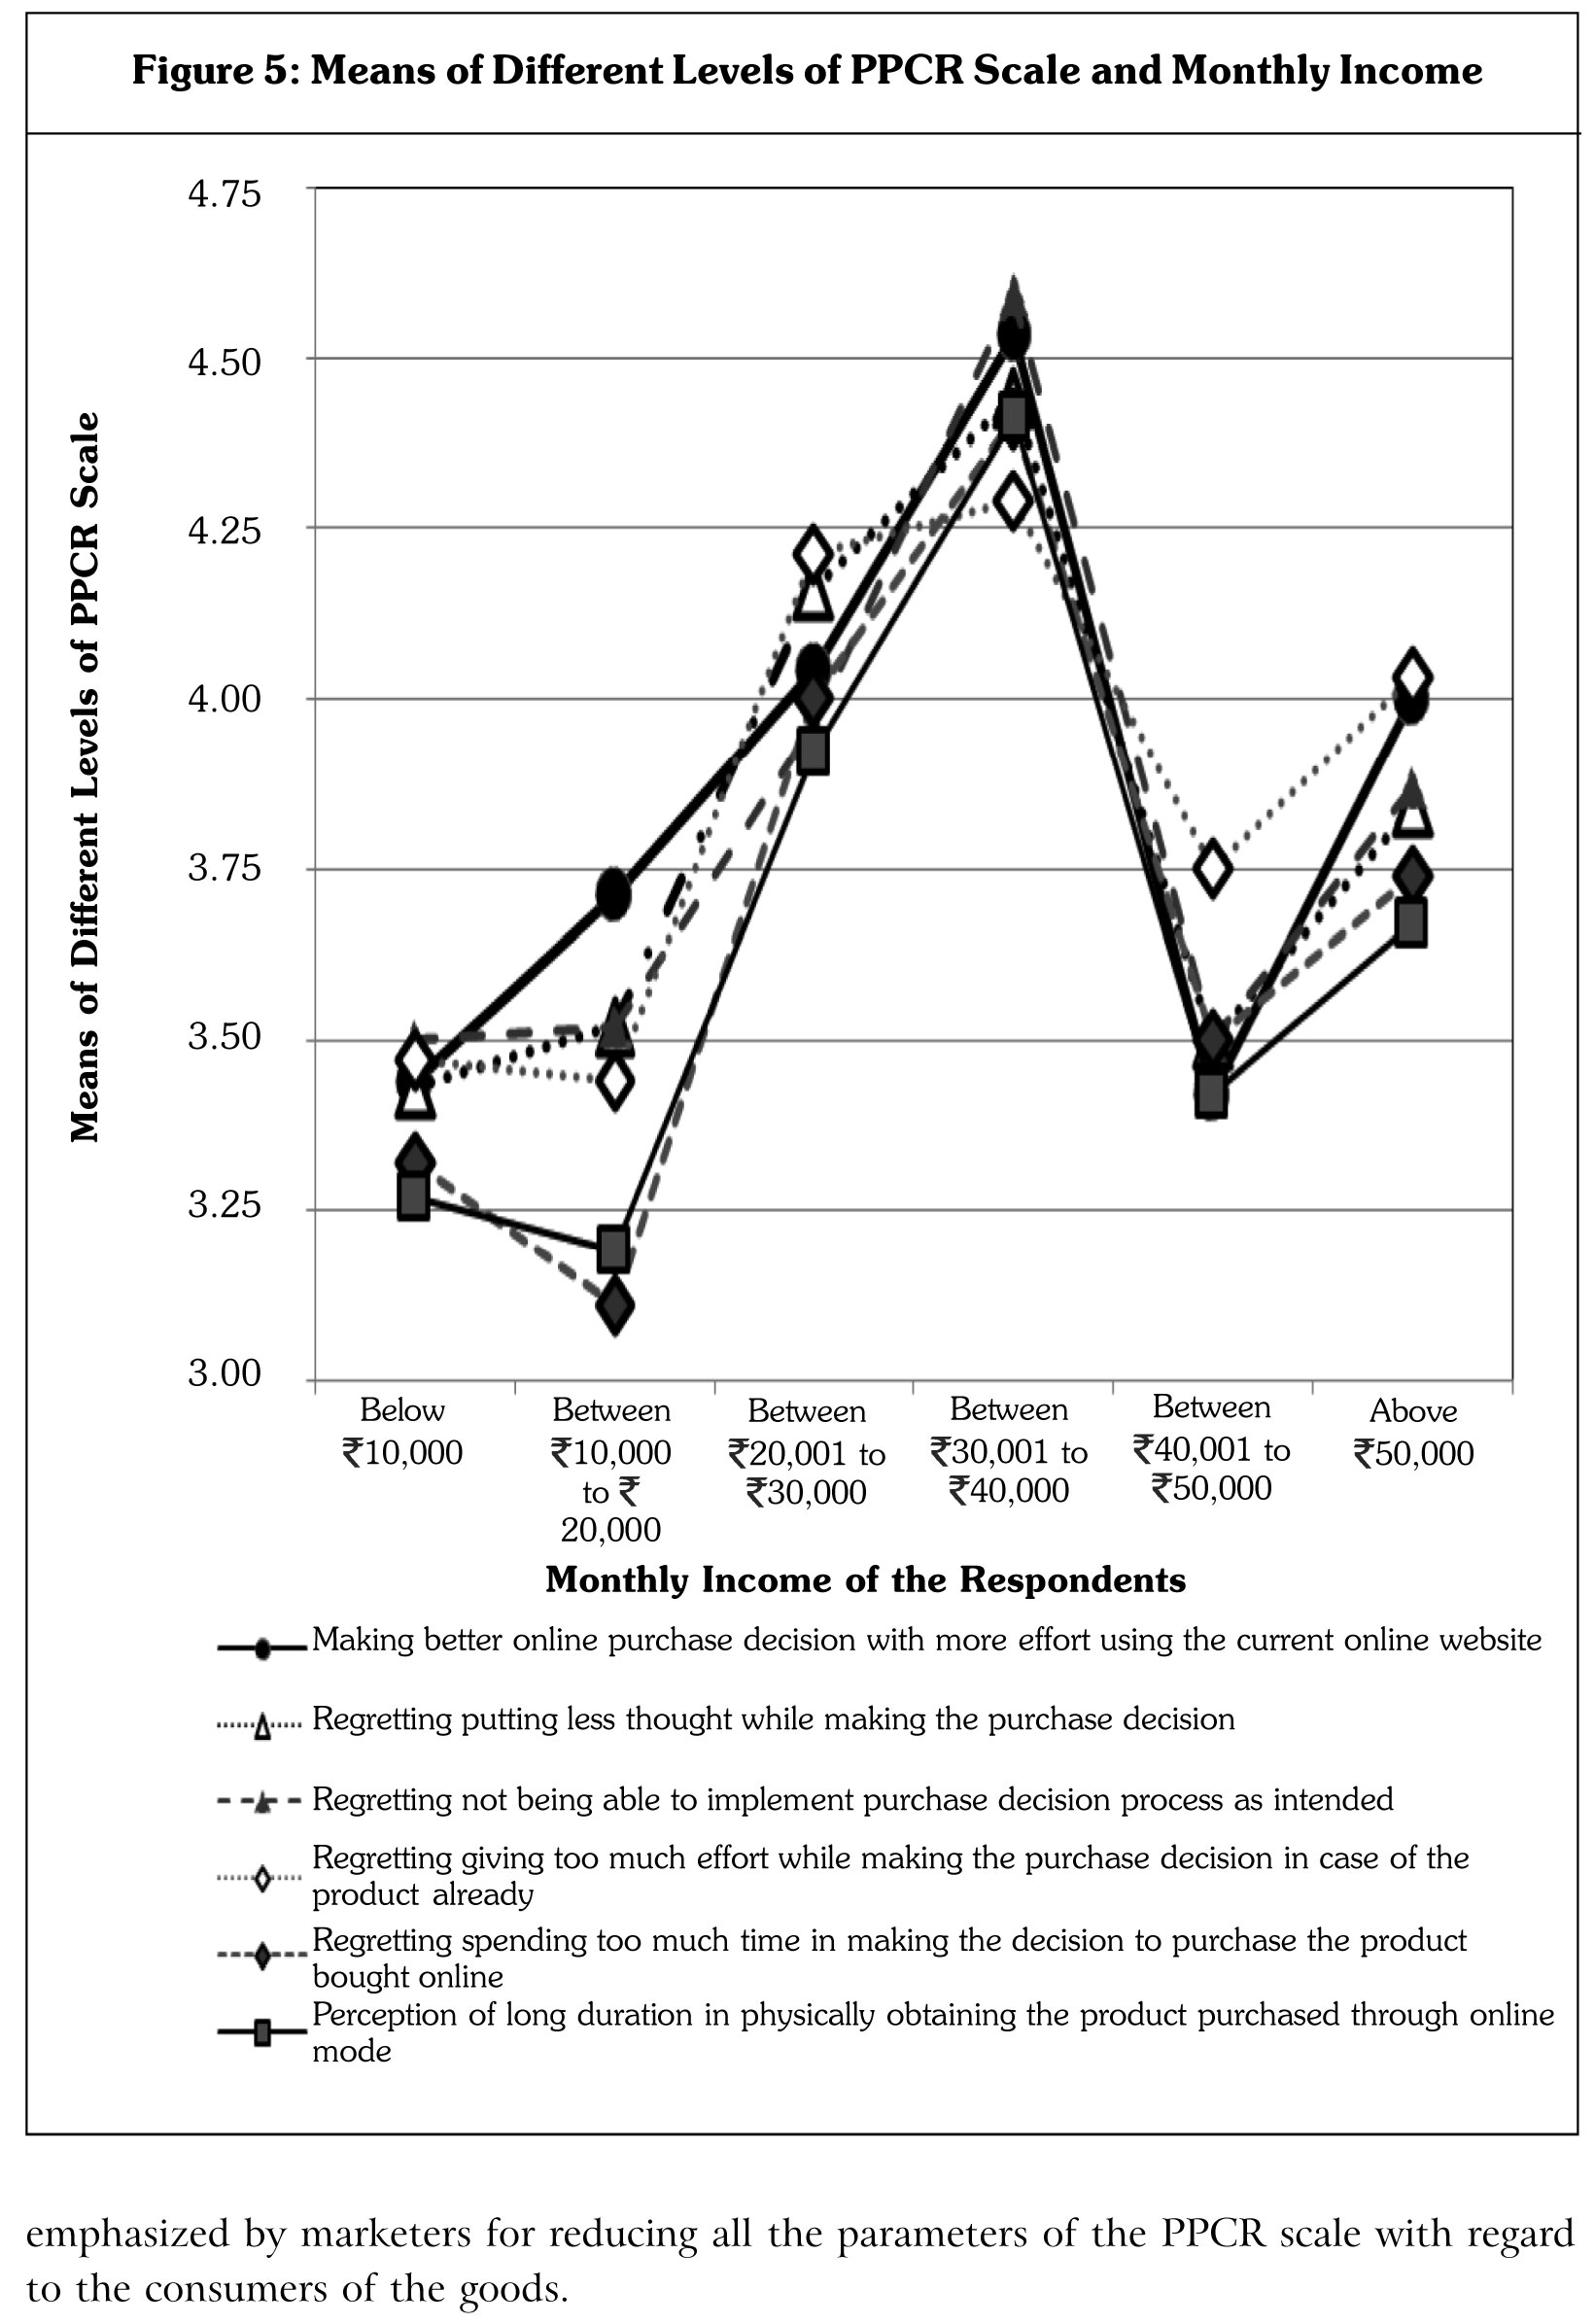
It was seen from similar One-way ANOVA tests that there were no significant differences among the means of respondents' perception regarding their levels of PPCR regarding all marketing mix elements of the goods with respect to different groups of their age, occupation, monthly income, and educational qualification
(p-value more than a = 0.05). As such, it was meaningless to carry out further analysis in these cases. Therefore, it can be inferred that the demographic variables may not be emphasized by marketers for reducing PPCR of the consumers of the goods.
Demographic Characteristics and PPCR Scale
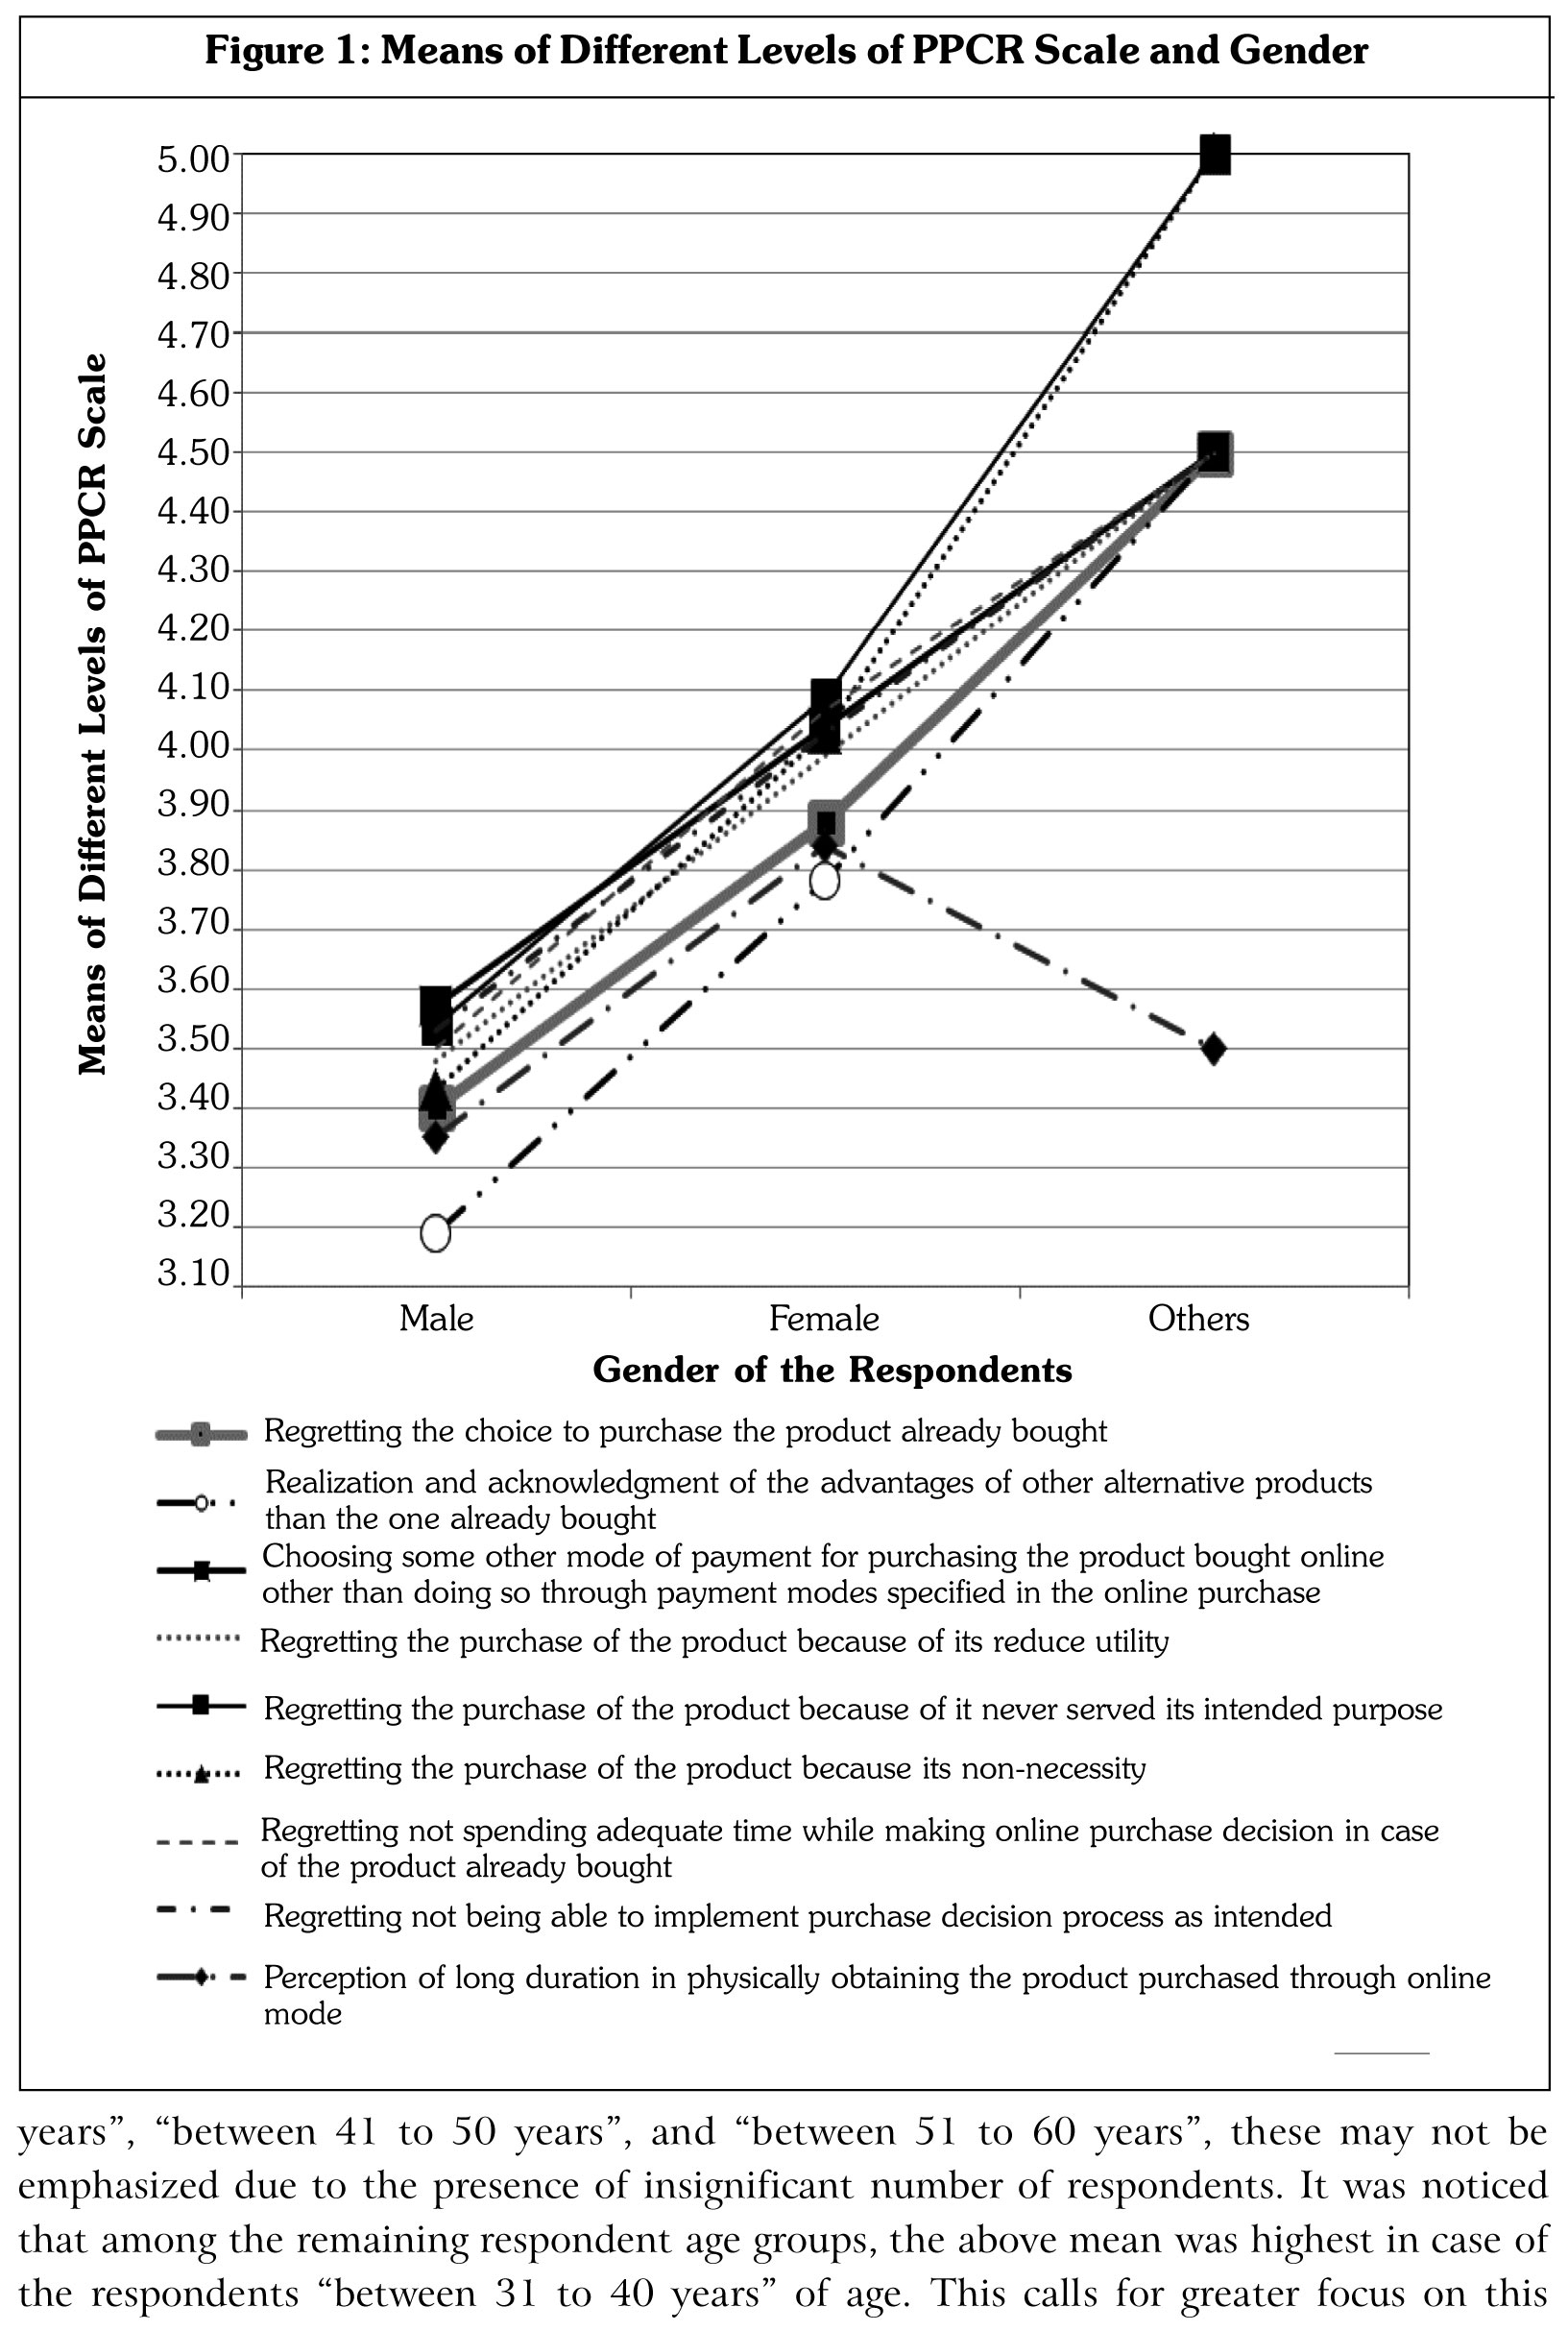
The results of One-way ANOVA indicated the existence of significant differences among the means of regretting the choice to purchase the product (a parameter of the formulated PPCR scale (refer to Table 2)) in case of white goods, brown goods and consumer electronics with respect to different groups of their gender (p-value = 0.035 less than a = 0.05). From the descriptive data, it may be inferred that marketers of the said categories of goods should seriously emphasize on female consumers in order to minimize chances of regretting the choice to purchase the product with respect to online purchase of such goods. Similarly, female consumers of aforementioned goods need to be focused in order to reduce chances of the remaining eight parameters in the aforesaid PPCR scale (from Serial No. 2 to 9) as shown in Figure 1, and Table A6 (in Appendix) .
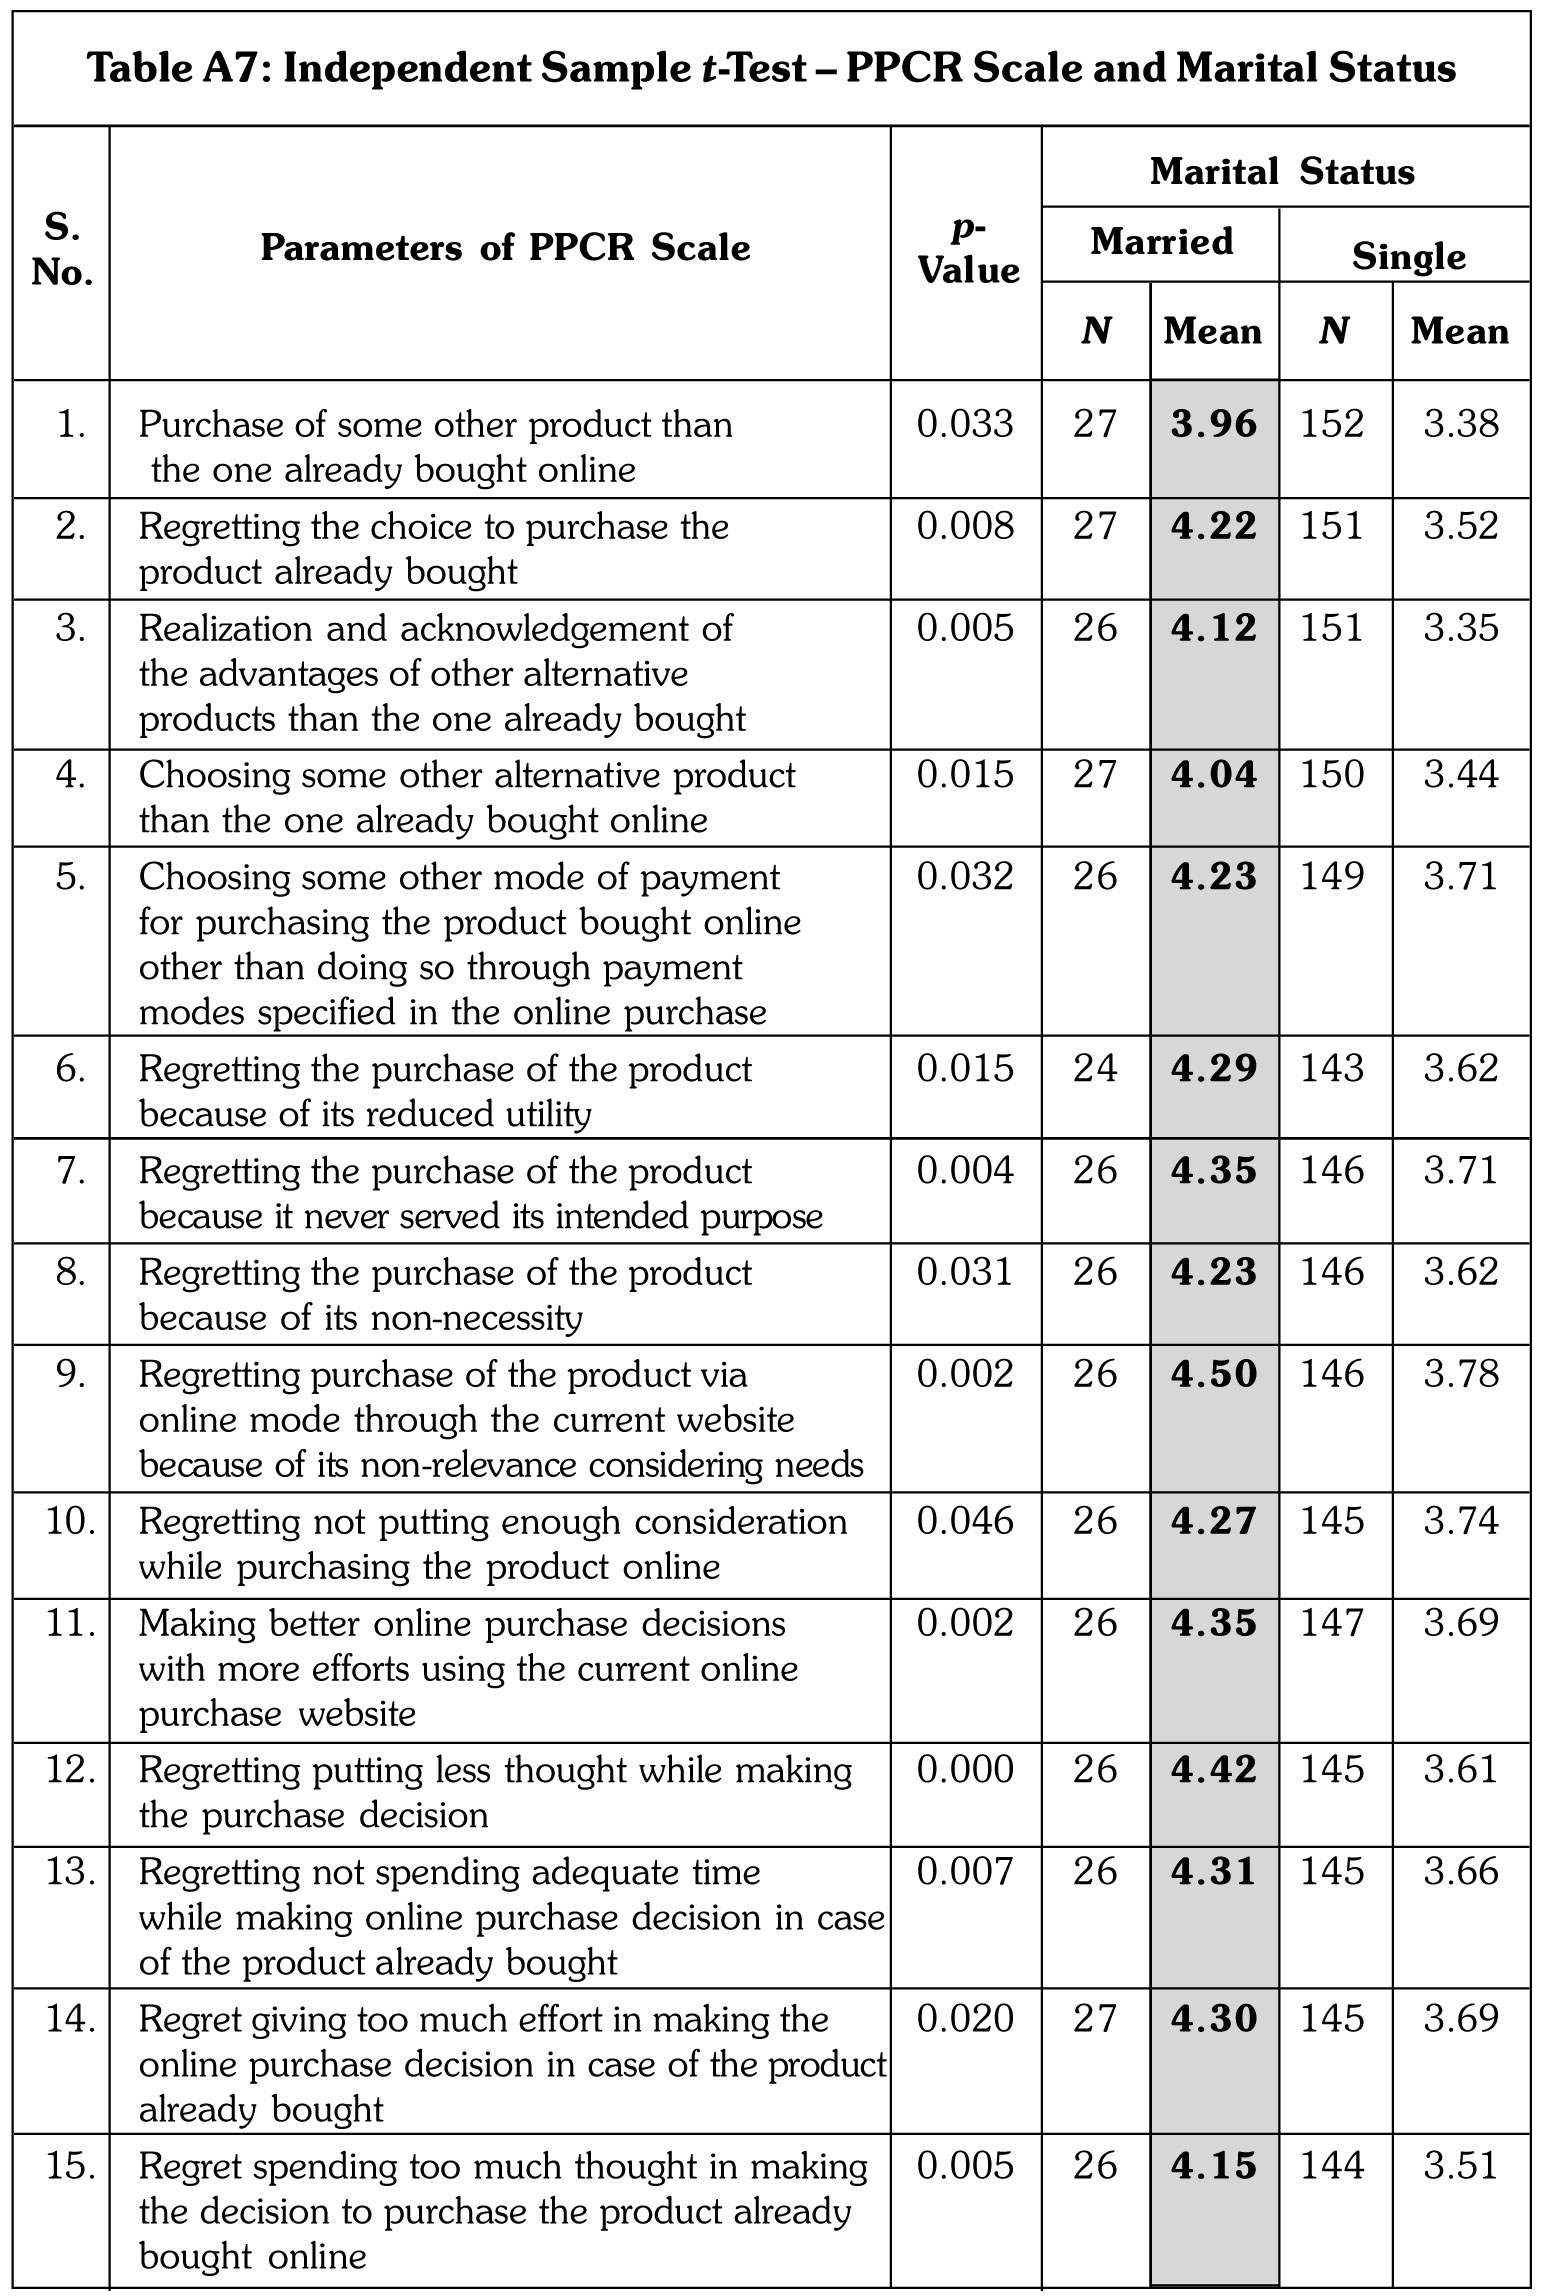
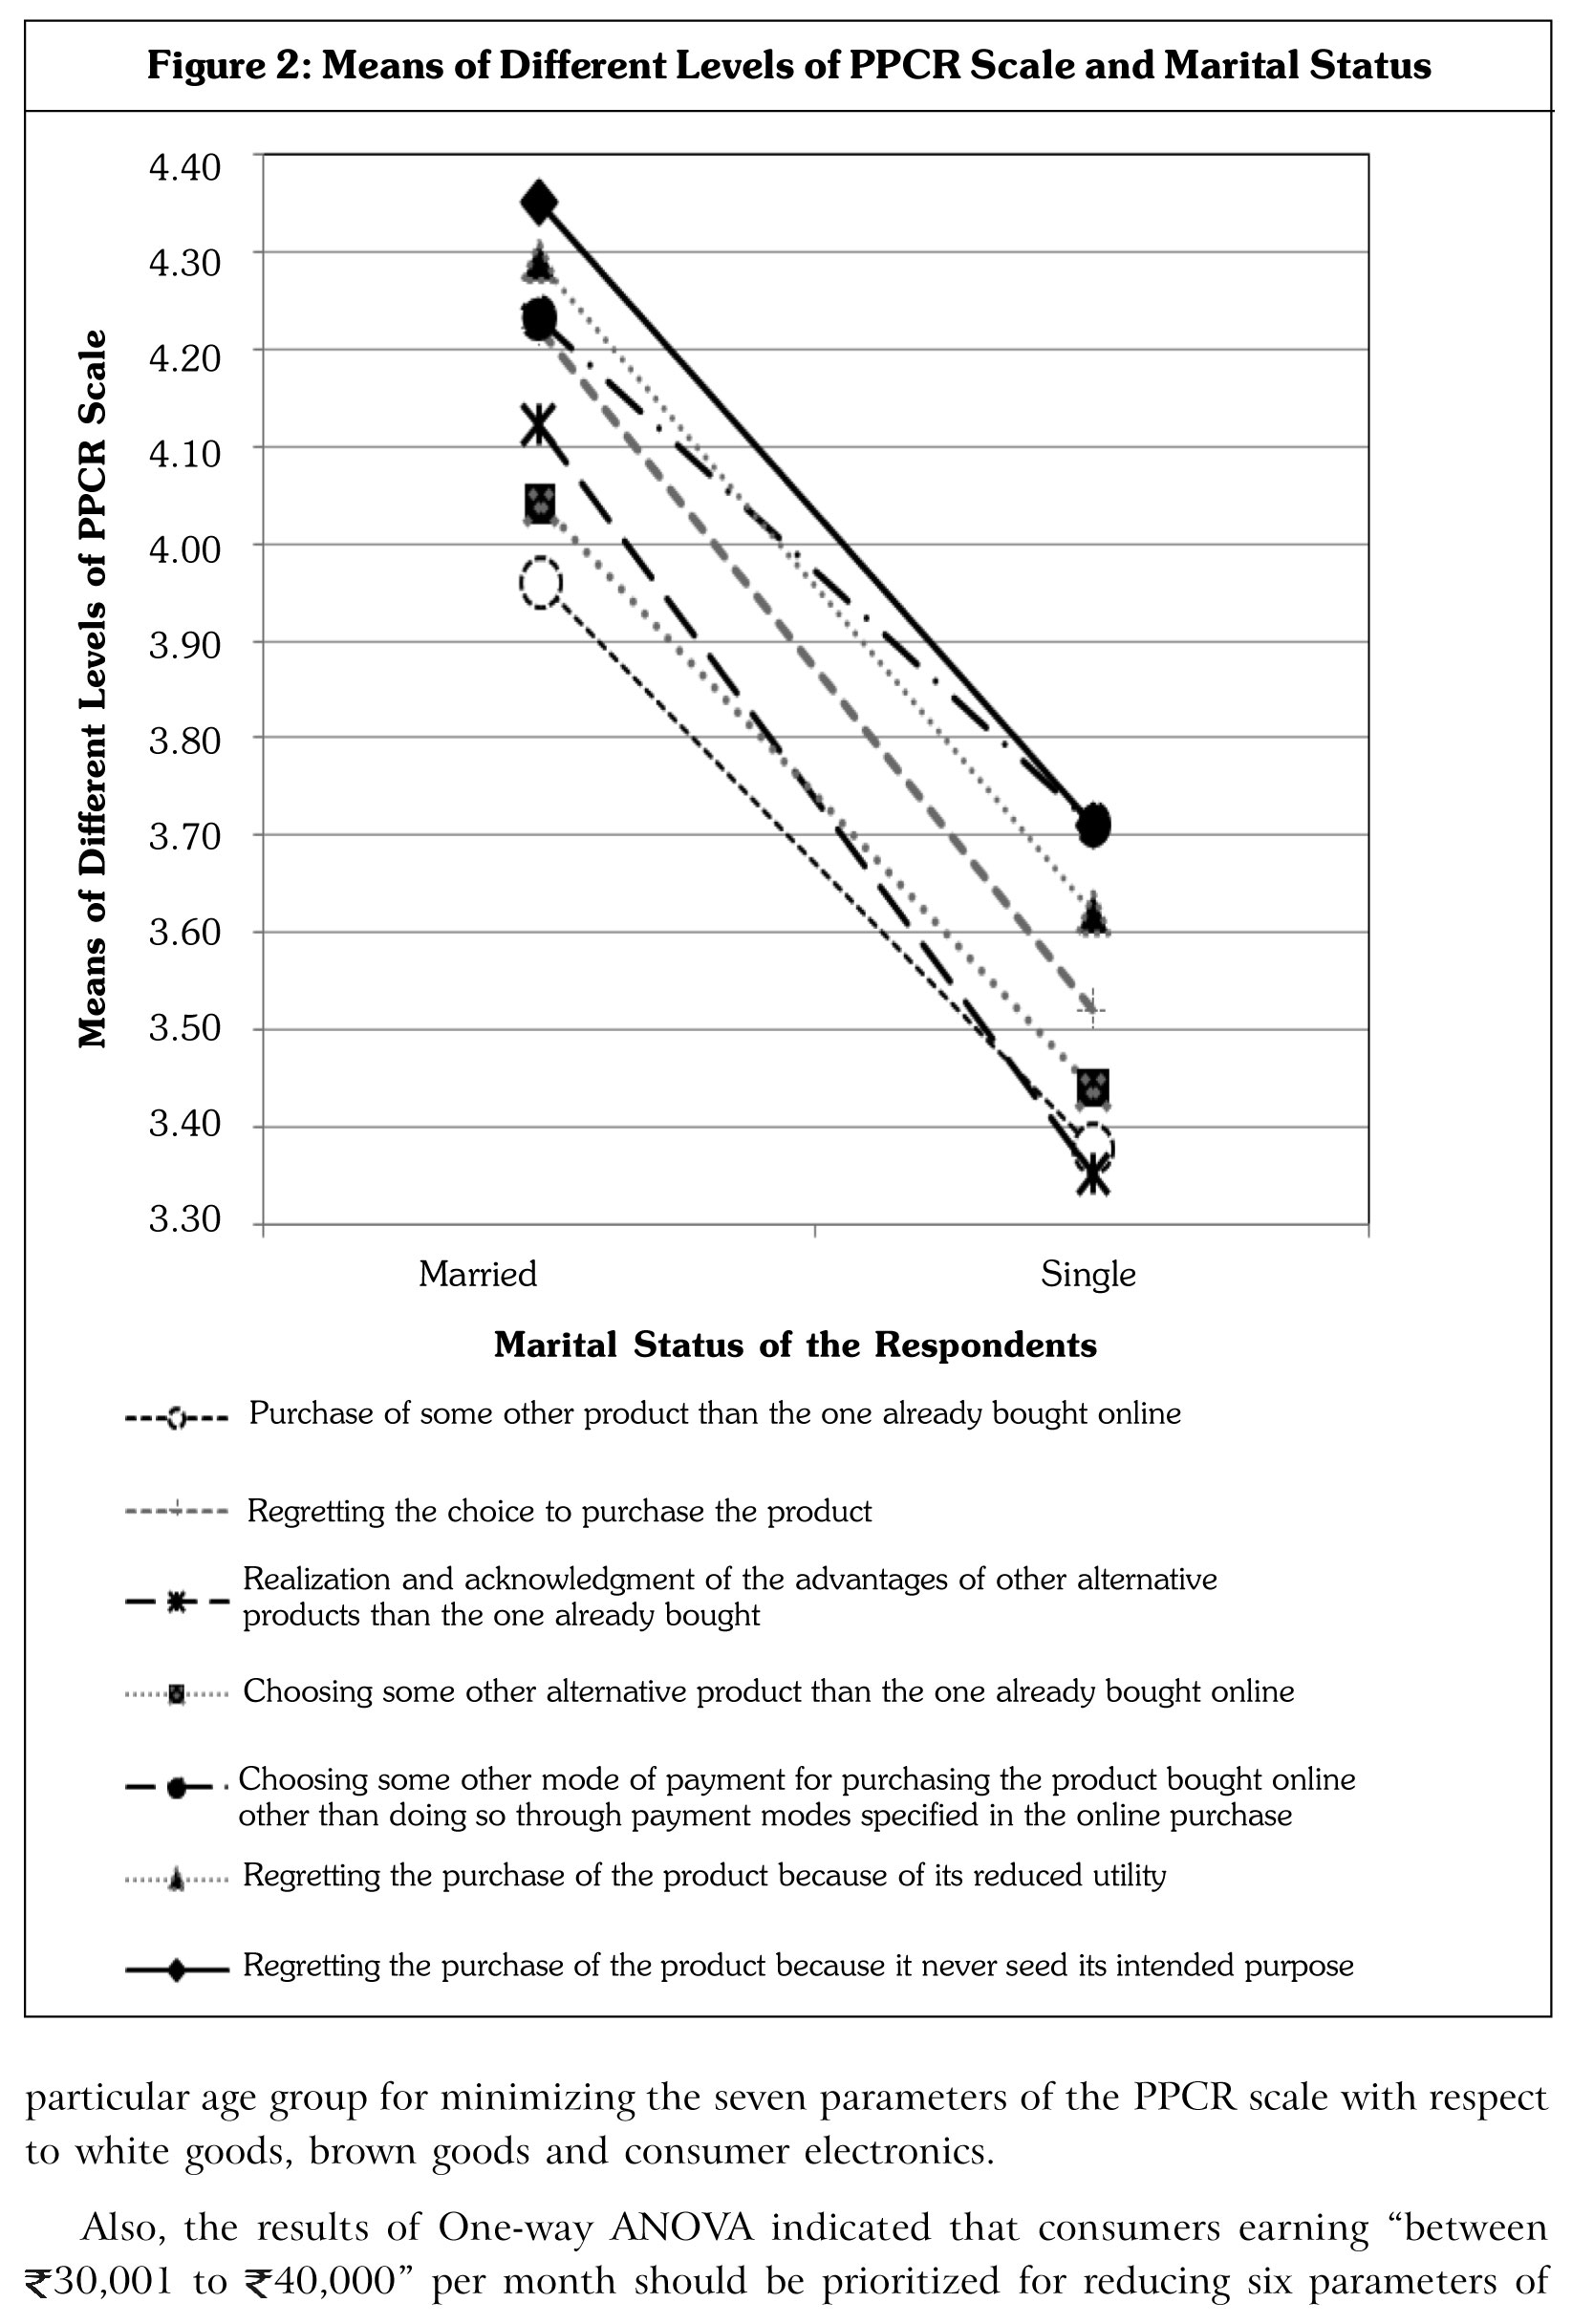
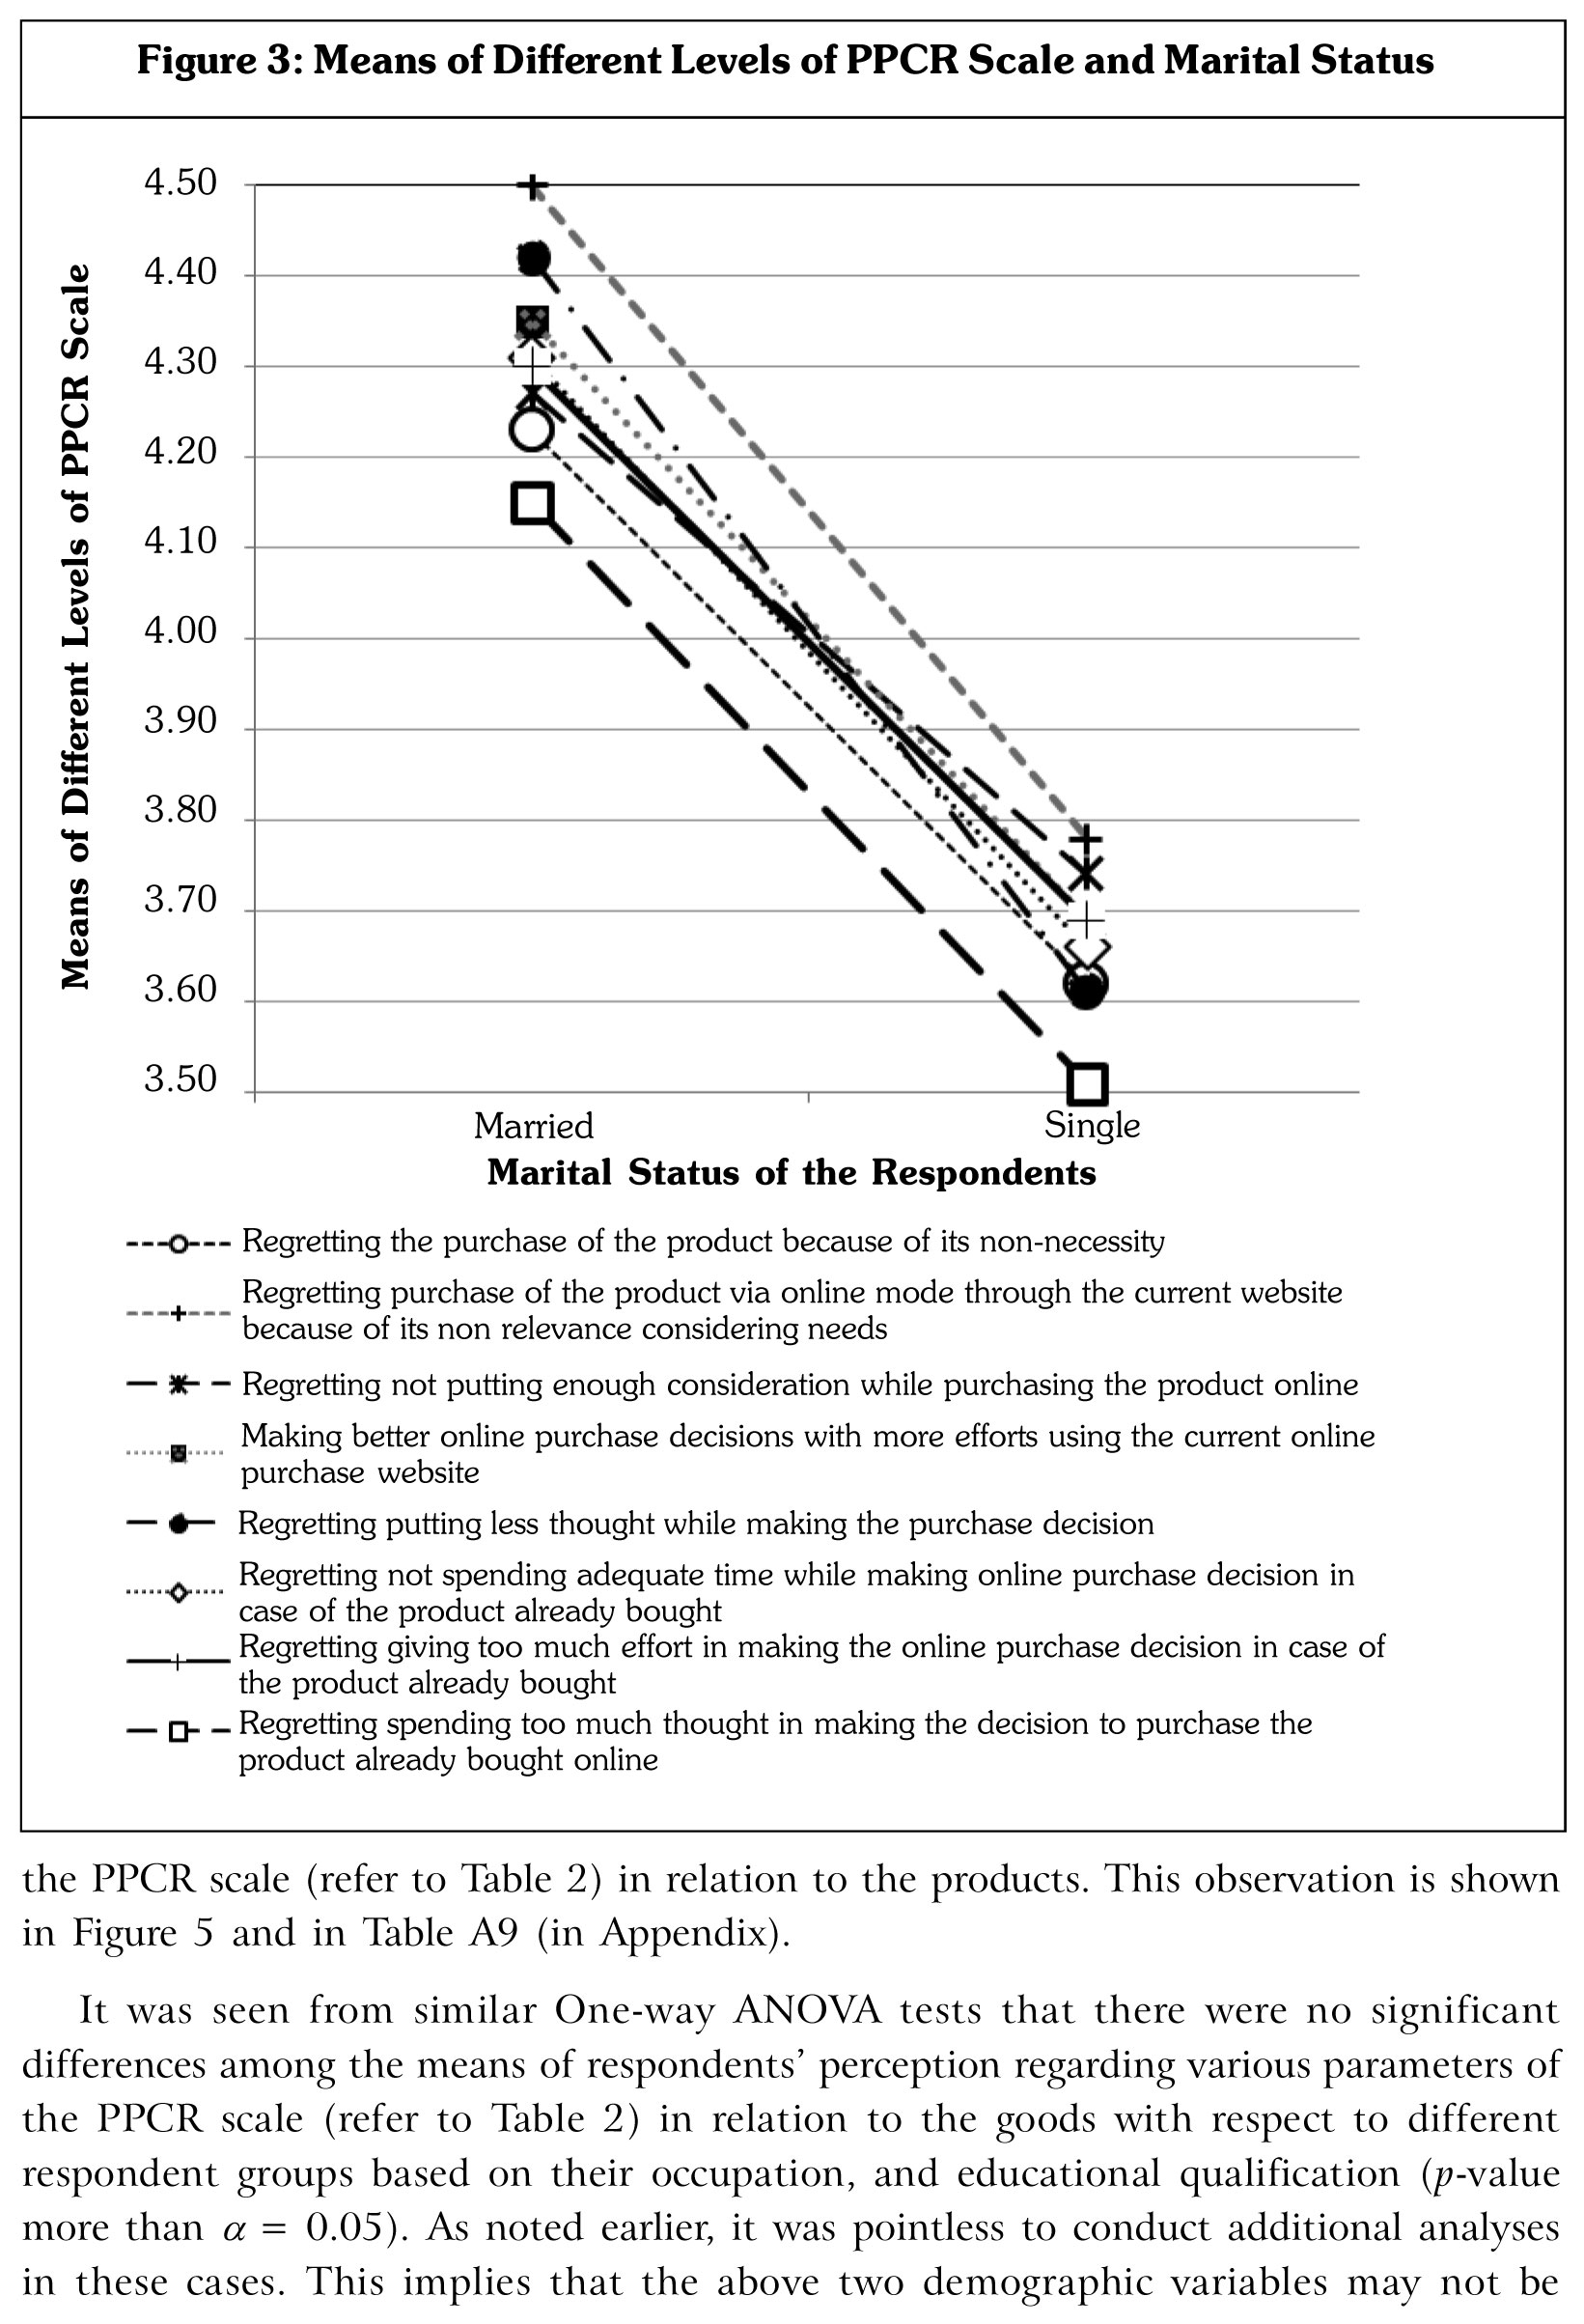
Similarly, married consumers of aforementioned goods need to be emphasized in order to reduce chances of fifteen parameters in the PPCR scale as shown in Figures 2 and 3, and Table A7 (in Appendix). These results are obtained from independent sample t-test.
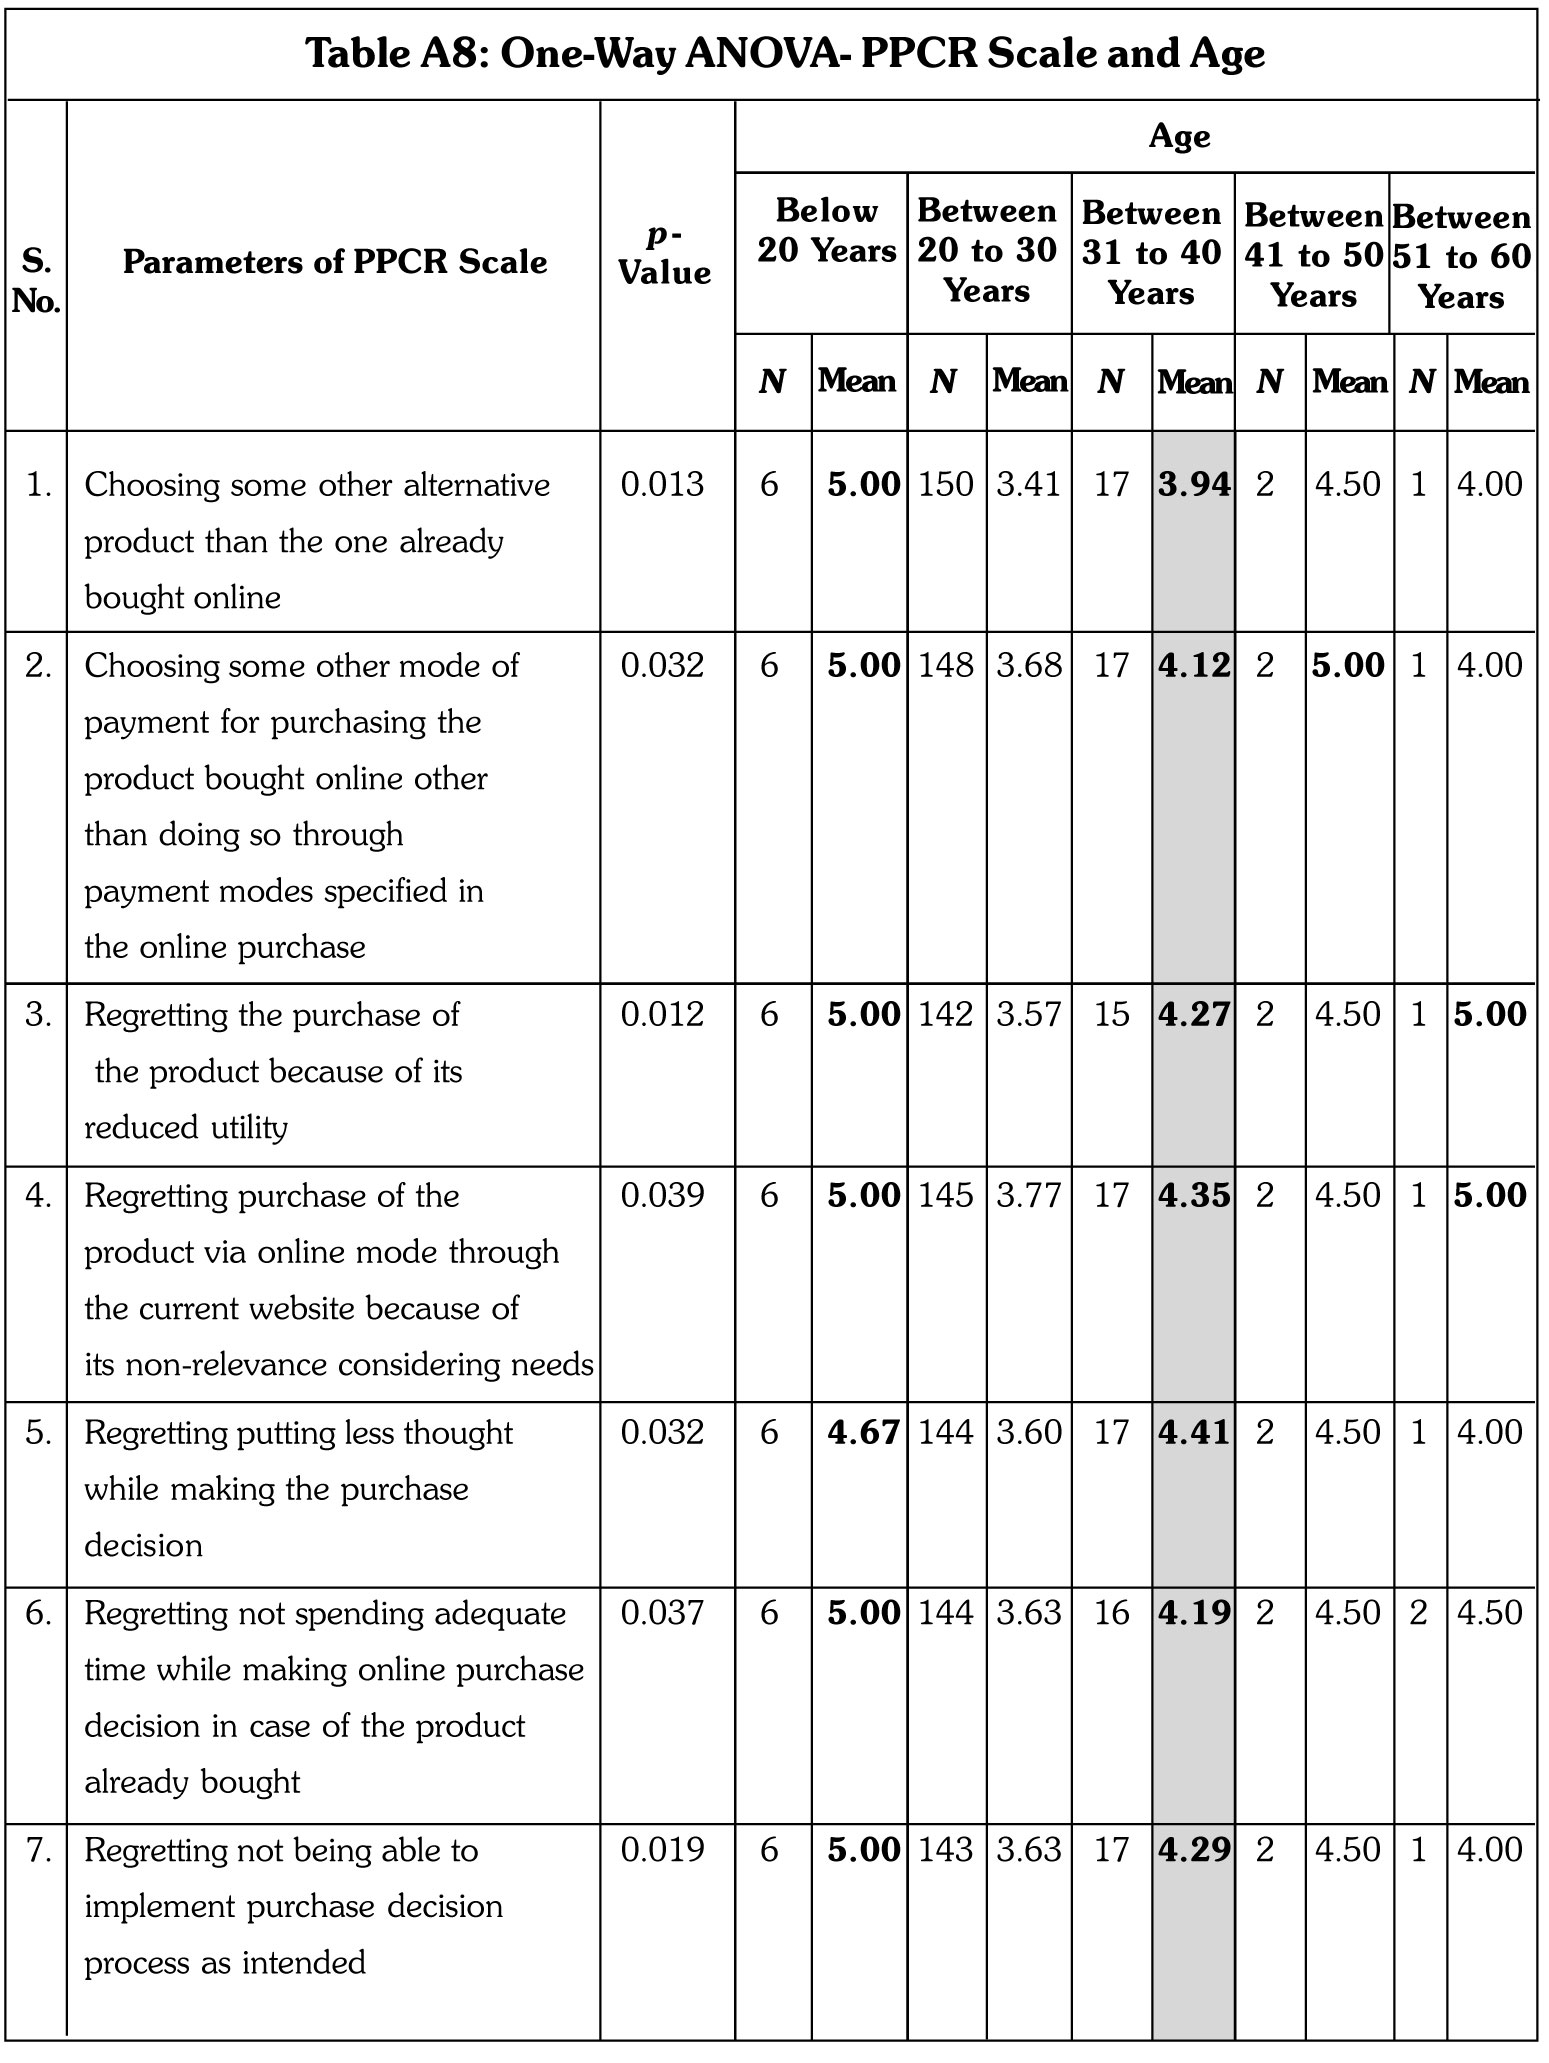
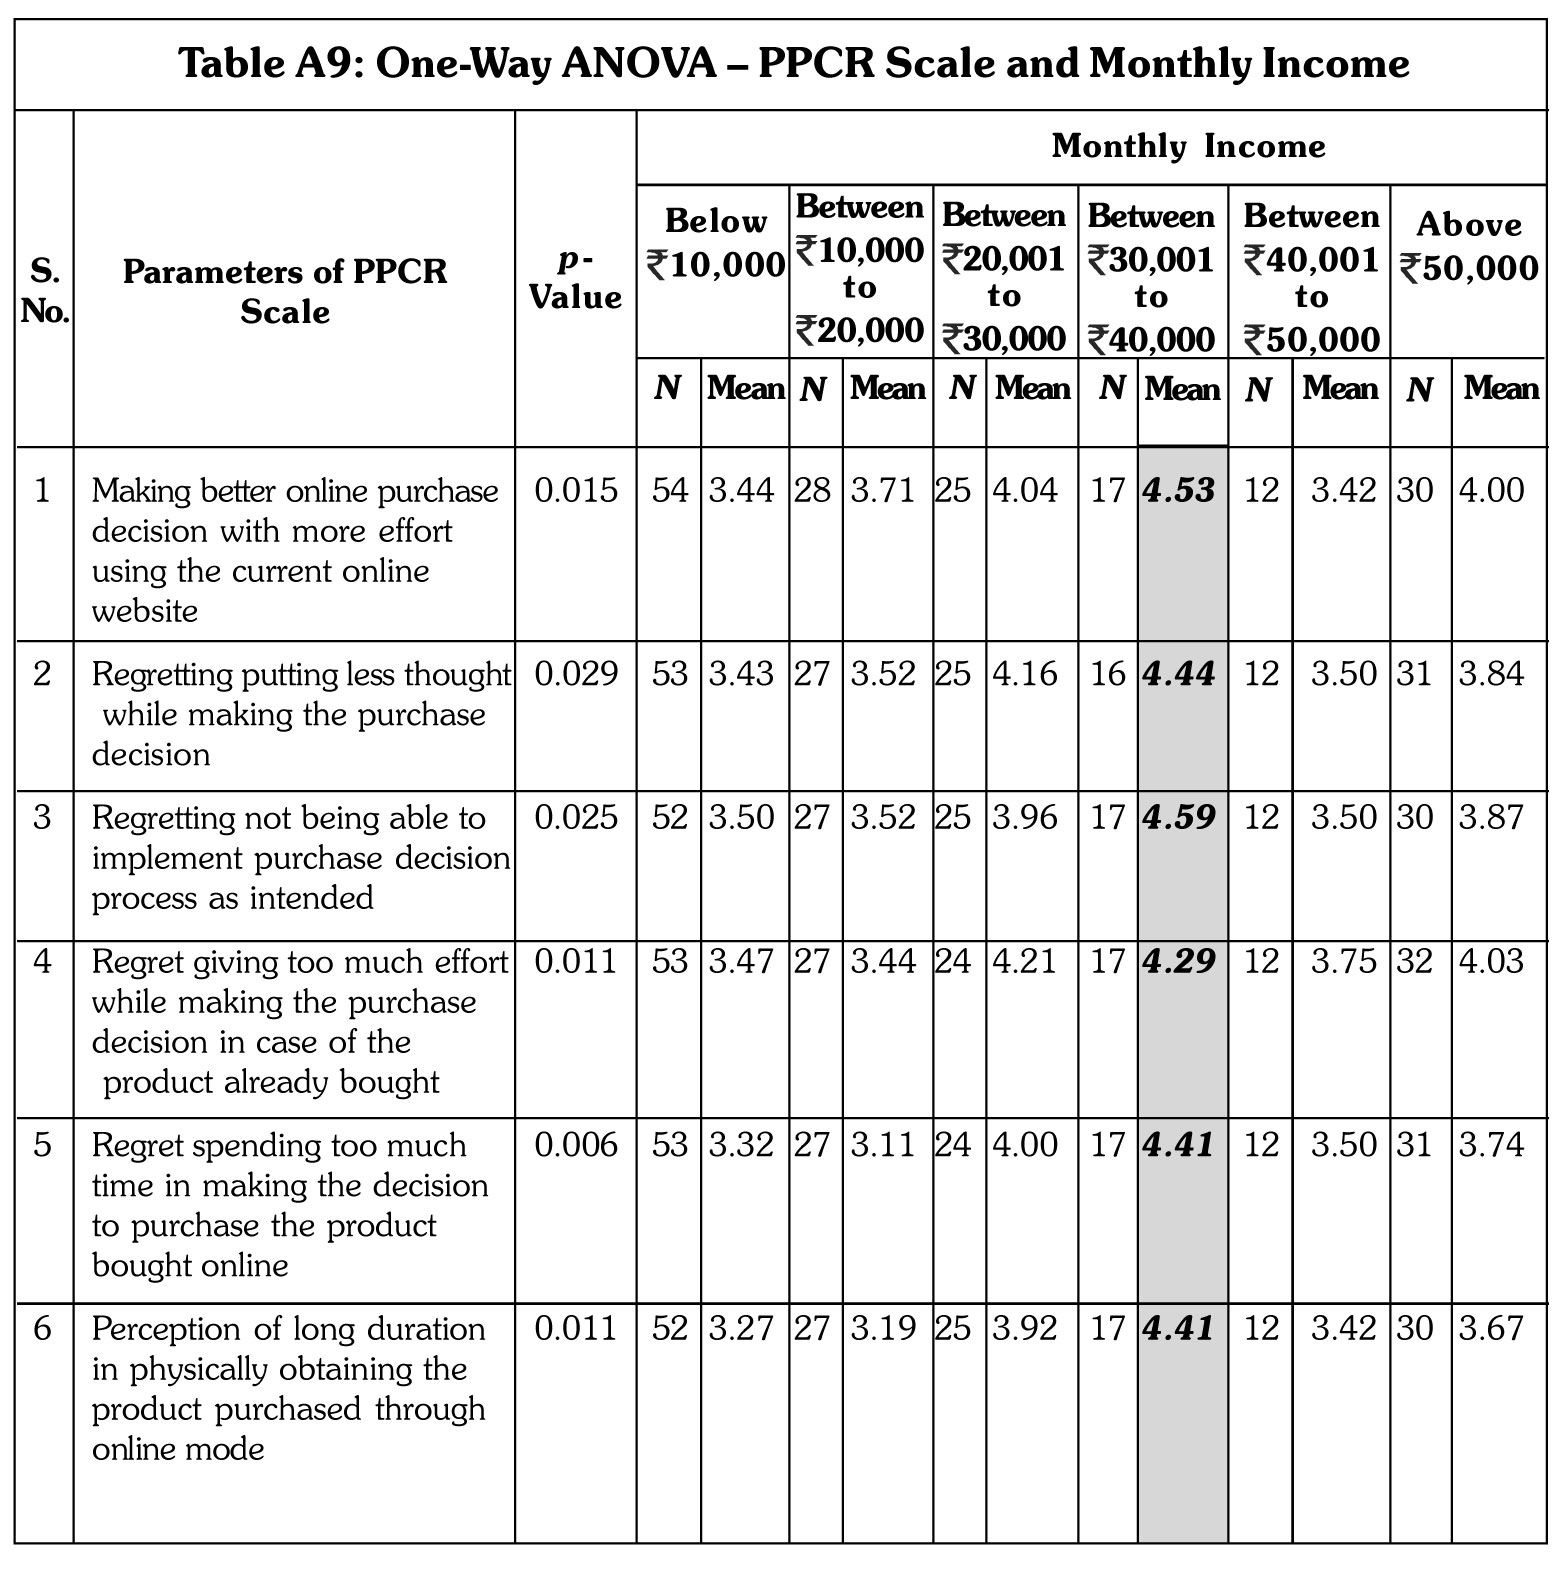
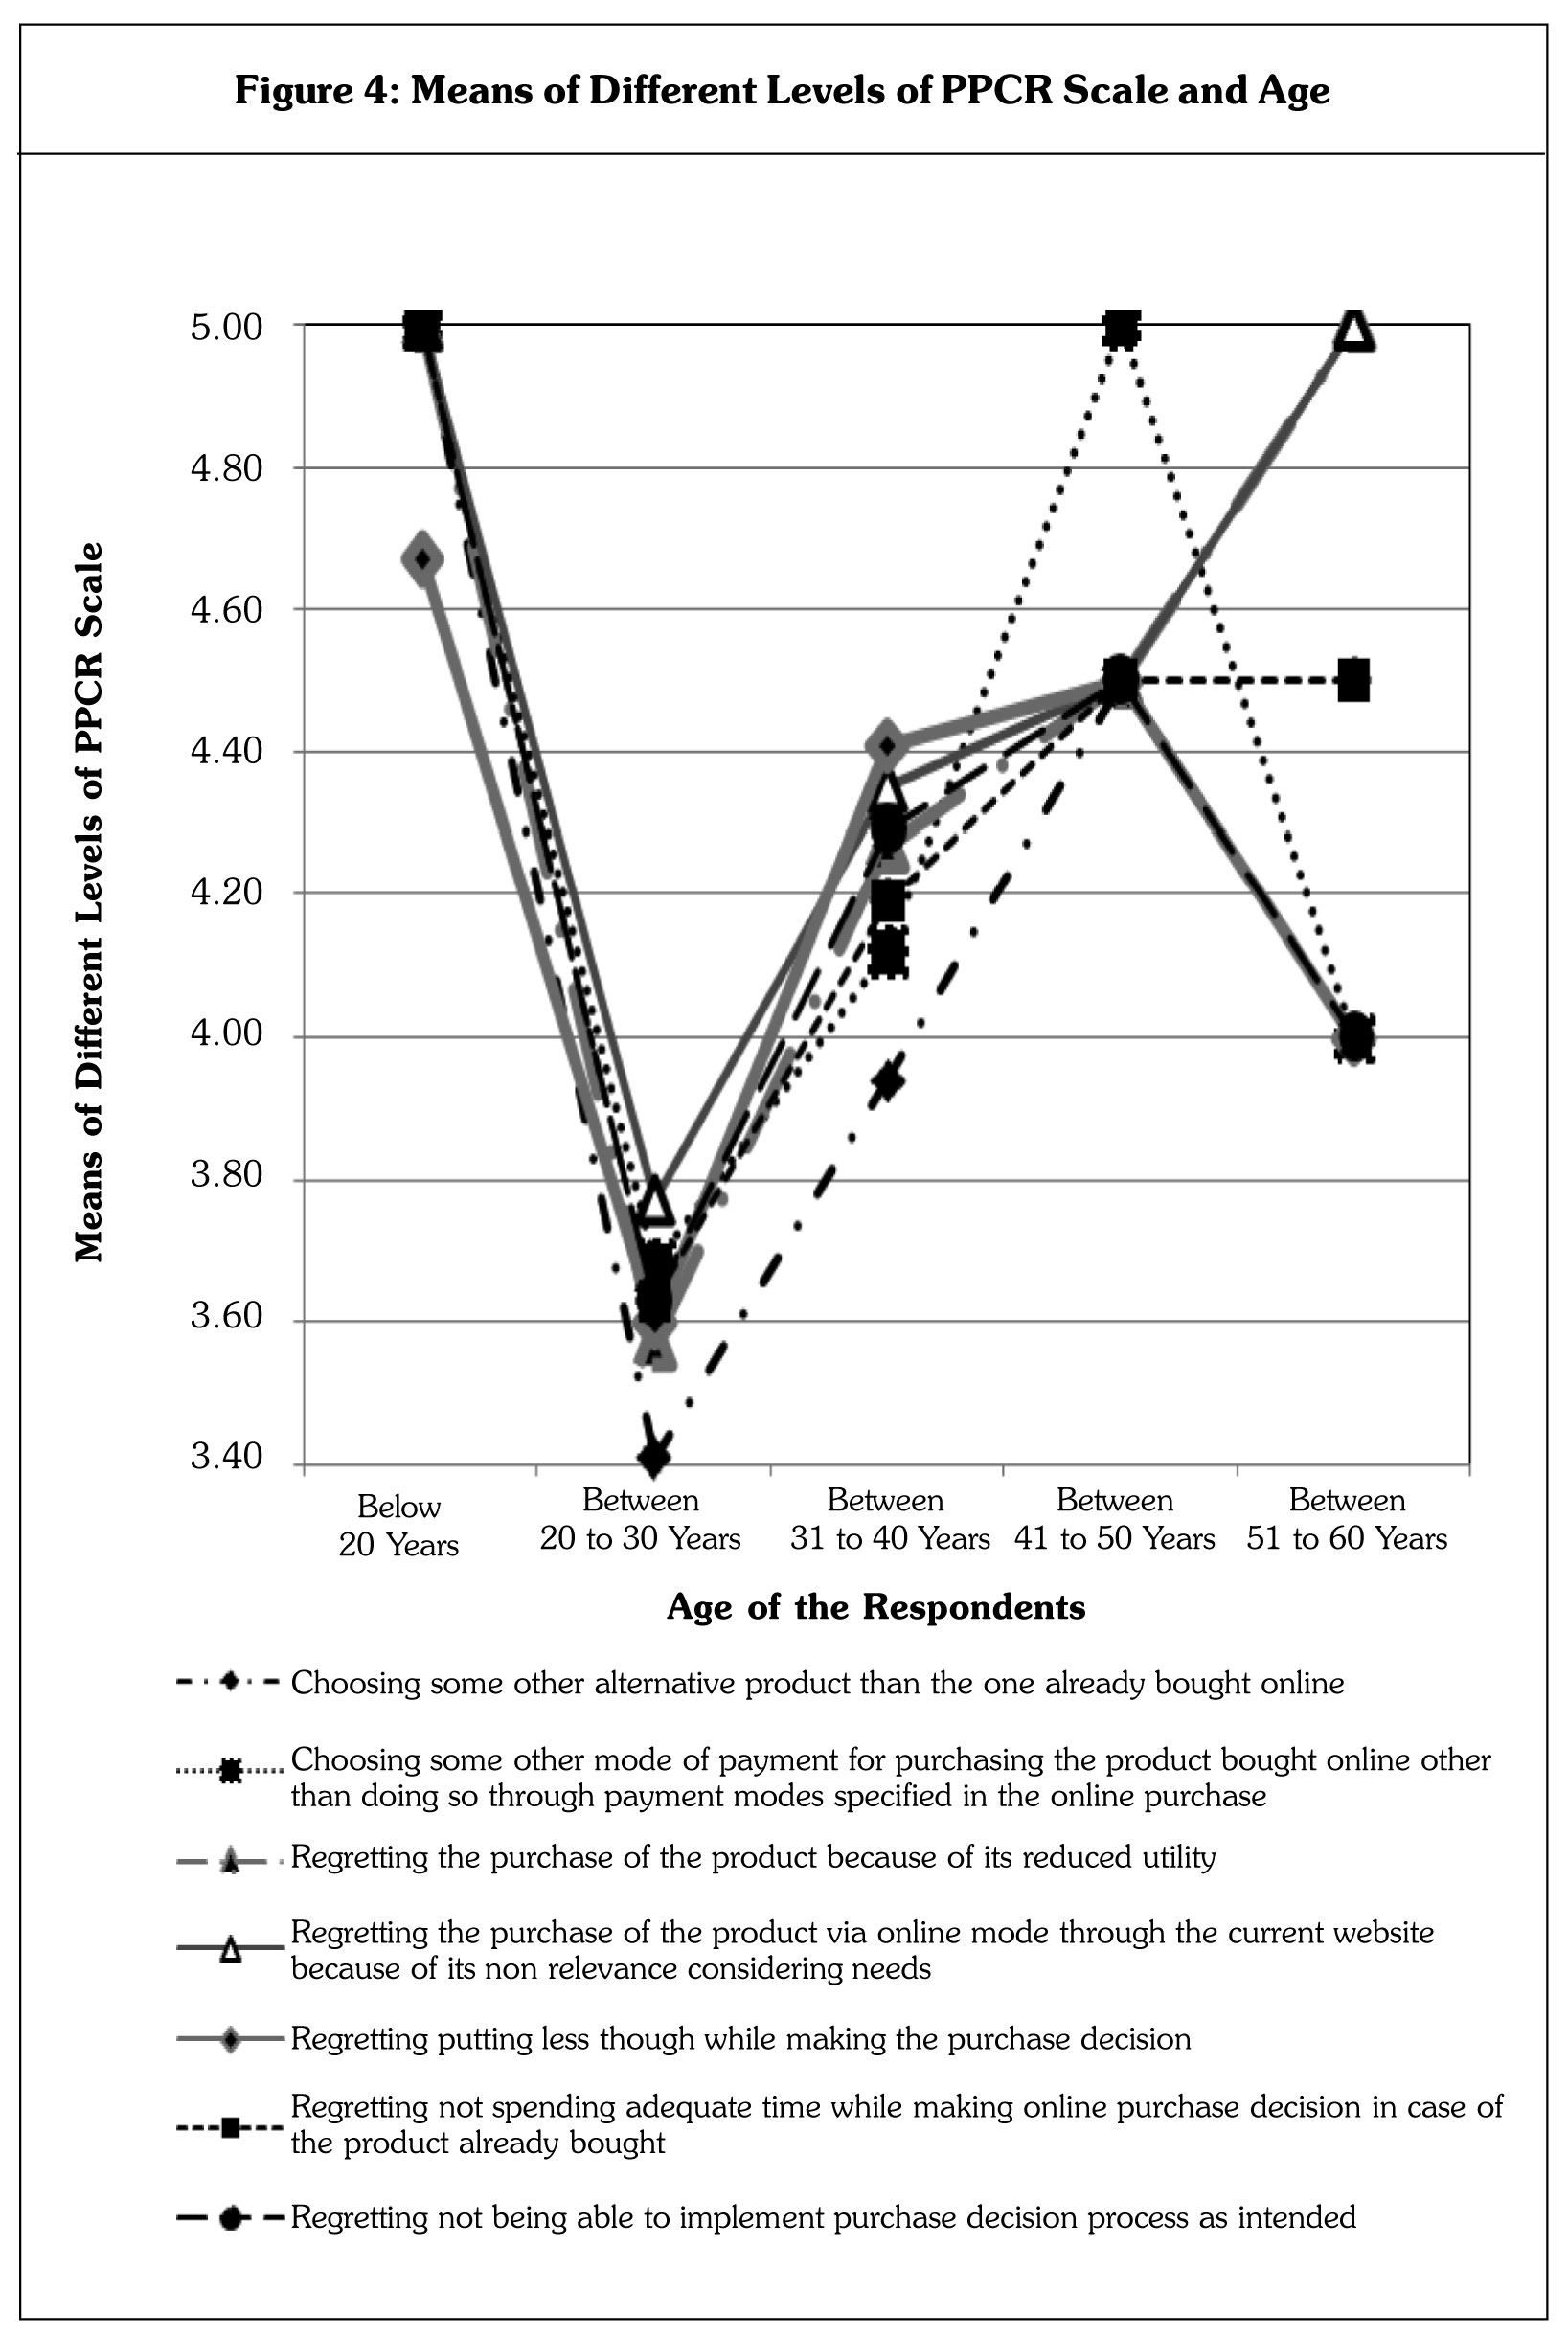
Likewise, the results of One-way ANOVA indicated the presence of significant differences among the means of seven parameters of the PPCR scale (refer to Table 2) with respect to different age groups of respondents (p-value less than a = 0.05) as shown in Figure 4 and Table A8 (in Appendix). Although the aforesaid means were higher in case of respondents in the age group of "below 20 years", "between 20 to 30
Discussion
The results of this study have indeed helped in validating a revised scale for measuring PPCR based on a similar scale devised by Seung and June (2009) in case of online purchase of white goods, brown goods and consumer electronics. The findings of this study have also highlighted critical points that need to be emphasized by manufacturer and sellers of such goods in order to reduce PPCR of such goods. It was found that marketers of the said categories of goods should heavily focus on female consumers so as to reduce PPCR taking quality, features, brand name, advertising, sales promotion, public relations, and direct marketing into account. Again, marketers of the said categories of goods should emphasize on married consumers for reduction of PPCR considering features of such goods. Further, the findings shows that marketers of the said categories of goods should seriously emphasize on female consumers in order to minimize chances of nine parameters in the PPCR scale (like regretting the choice to purchase the product etc.) with respect to such goods.
Similarly, married consumers of the goods need to be emphasized in order to reduce chances of fifteen parameters in the earlier mentioned PPCR scale (like purchase of some other product than the one already bought online, regretting the choice to purchase the product etc.). Also, there should be greater focus on consumers "between 31 to 40 years" for minimizing seven parameters of the PPCR scale with respect to the products (like choosing some other alternative product than the one already bought online, choosing some other mode of payment for purchasing the product bought online other than doing so through payment modes specified in the online purchase etc.). Besides, consumers having monthly income "between 30,001 to 40,000" should be prioritized for reducing six parameters of the PPCR scale in relation to the products (like making better online purchase decision with more effort using the current online website, regretting on putting less thought while making the purchase decision etc.).
The findings are critical for any marketer of white goods, brown goods and consumer electronics for minimizing chances of PPCR. As noted earlier, this can help in satisfying their consumers. This can result in repeat purchases that can, in turn, lead towards increasing the base of loyal consumers (Rudolf and Swaminathan, 2011; and Suja, 2011). This may lead to consistent profitability of any manufacturer and seller of such goods.
Conclusion
The removal or minimization of any form of regret after purchase (and usage) of any product among their consumers (users) is highly essential as it definitely leads to lesser dissatisfaction, thereby improving their levels of satisfaction. As mentioned earlier, this process will result in continued profitability and survivability of manufactures and sellers of such products (including white goods, brown goods and consumer electronics). This study has indicated a few groups of consumers of the three categories of goods who need to be stressed upon by their manufactures and sellers for reducing chances of PPCR.
Limitations: This study was conducted involving a sample size of 200 respondents and was carried out only in the State of Assam in North-East India. Besides, the method of sampling used in this study was snowball sampling with its own inherent limitations.
Future Scope: It can be stated that the findings of this study will open further prospects of research in the stated subject in other parts of India and the world in general. Such research studies may involve additional parameters of PPCR scale. In addition, these studies may be carried out involving a larger sample size.J
References
- Albert O Hirschman (1970), Exit, Voice, and Loyalty, Harvard University Press, Cambridge MA.
- Ali Turkilmaz and (2007), "Development of a Customer Satisfaction Index Model", Industrial Management and Data Systems, Vol. 107, No. 5, pp. 672-687.
- Anne W Magi (2003), "Share of Wallet in Retailing: the Effects of Customer Satisfaction, Loyalty Cards and Shopper Characteristics", Journal of Retailing, Vol. 79, No. 2, pp. 97-106.
- Avi Shanker, Helene Cherrier and Robin Canniford (2006), "Consumer Empowerment: A Foucauldian Interpretation", European Journal of Marketing, Vol. 40, No. 9, pp. 1013-1030.
- Barry L Bayus (1991), "The Consumer Durable Replacement Buyer", Journal of Marketing, Vol. 55, No. 1, pp. 42-51.
- Bhawaniprasad G V and Kumari S C (1987), "Impact of Advertising on Consumer Durables Markets: A Study of Refrigerator Consumer", Indian Journal of Marketing, Vol. 18, No. 1, pp. 21-30.
- Blair Wheaton, Bengt Muthen, Duane F Alwin and Gene F Summers (1977), "Assessing Reliability and Stability in Panel Models", Sociological Methodology, Vol. 8, No. 1, pp. 84-136.
- Cameron McIntosh (2006), "Rethinking Fit Assessment in Structural Equation Modelling: A Commentary and Elaboration on Barrett", Personality and Individual Differences, Vol. 42, No. 5, pp. 859-867.
- Care Ratings (2018), "Consumer Durables Industry - Structure and Prospects, India", available at https:// www.scribd.com/document/407912929/industry-research-pdf
- Chao-Min Chiu, Eric T C Wang, Yu-Hui Fang and Hsin-Yi Huang (2014), "Understanding Customers' Repeat Purchase Intentions in B2C E-commerce: The Roles of Utilitarian Value, Hedonic Value and Perceived Risk", Information Systems Journal, Vol. 24, No. 1, pp. 85-114.
- Daire Hooper, Joseph Coughlan and Michael R Mullen (2008), "Structural Equation Modelling: Guidelines for Determining Model Fit", The Electronic Journal of Business Research Methods, Vol. 6, No. 1, pp. 53-60.
- David A Aaker, Kumar V, Robert P Leone and George S Day (2016), Marketing Research, 11th Edition, Wiley India (P) Limited, New Delhi.
- David A Kenny and Betsy McCoach D (2003), "Effect of the Number of Variables on Measures of Fit in Structural Equation Modeling", Structural Equation Modeling, Vol. 10, No. 3, pp. 333-351.
- David E Bell (1982), "Regret in Decision Making Under Uncertainty", Operations Research, Vol. 30, No. 5, pp. 961-981.
- David E Bell (1985), "Disappointment in Decision-Making Under Uncertainty", Operations Research, Vol. 33, No. 1, pp. 1-27.
- Deepak Chawla and Neena Sondhi (2011), Research Methodology, 1st Edition, Vikas Publishing House Private Limited, Noida.
- Desmond Lam (2007), "Cultural Influence on Proneness to Brand Loyalty", Journal of International Consumer Marketing, Vol. 19, No. 3, pp. 7-21.
- Donald R Cooper, Pamela S Schindler and Sharma J K (2019), Business Research Methods, 12th Edition (Special Indian ed.), McGraw-Hill Education, Chennai.
- Dwayne Ball, Pedro Simoes-Coelho and Alexandra Machas (2004), "The Role of Communication and Trust in Explaining Customer Loyalty: An Extension of the ESCI Model", European Journal of Marketing, Vol. 38, Nos. 9/10, pp. 1272-1293.
- Eduardo Torres-Moraga, Arturo Z Vasquez-Parraga and Jorge Zamora-Gonzalez (2008), "Customer Satisfaction and Loyalty: Start with the Product, Culminate with the Brand", Journal of Consumer Marketing, Vol. 25, No. 5, pp. 302-313.
- Elizabeth H Creyer and Willian T Ross Jr. (1999), "The Development and Use of a Regret Experience Measure to Examine the Effects of Outcome Feedback on Regret and Subsequent Choice", Marketing Letters, Vol. 10, No. 4, pp. 373-86.
- Gilbert A. Jr. Churchill (1979), "A Paradigm for Developing Better Measures of Marketing Constructs", Journal of Marketing Research, Vol. 16, No. 1, pp. 64-73.
- Graham Loomes and Robert Sugden (1982), "Regret Theory: An Alternative Theory of Rational Choice under Uncertainty", Economic Journal, Vol. 92, No. 368, pp. 805-824.
- Hong-Youl Ha, Swinder Janda and Siva K Muthaly (2010), "A New Understanding of Satisfaction Model in E-re-purchase Situation", European Journal of Marketing, Vol. 44, Nos. 7-8, pp. 997-1016.
- Ilana Ritov and Jonathan Baron (1995), "Outcome Knowledge, Regret, and Omission Bias", Organizational Behavior and Human Decision Processes, Vol. 64, No. 2, pp. 119-127.
- Indian Brand Equity Foundation (IBEF) (2019), Consumer Durables, India, available at https://www.ibef. org/download/Consumer-Durables-August-2019.pdf
- Isabel Sanchez-Garcia and Rafael Curras-Perez R (2011), "Effects of Dissatisfaction in Tourist Services: The Role of Anger and Regret", Tourism Management, Vol. 32, No. 6, pp. 1397-1406.
- Isita Lahiri and Juin Ghosh Sarkar (2018), "Consumers' online Buying Behaviour: A Study With Reference To Home Appliances in Kolkata", International Journal of Business and Management Invention (IJBMI), Vol. 7, No. 12, pp. 1-8.
- Jeffrey Inman J, James S Dyer and Jianmin Jia (1997), "A Generalized Utility Model of Disappointment and Regret Effects on Post-Choice Valuation", Marketing Science, Vol. 16, No. 2, pp. 97-111.
- Jai-Ok Kim, Sandra Forsythe, Qingliang Gu and Sook J Moon (2002), "Cross-cultural Consumer Values, Needs and Purchase Behavior", Journal of Consumer Marketing, Vol. 19, No. 6, pp. 481-502.
- Jan-Benedict E M Steenkamp, Hans C M and Van Trijp H C M (1991), "The Use of Lisrel in Validating Marketing Constructs", International Journal of Research in Marketing, Vol. 8, No. 4, pp. 283-299.
- Joseph F Hair Jr., William C Black, Barry J Babin and Rolph E Anderson (2006), Multivariate Data Analysis, 6th Edition, Pearson Education Private Limited, New Delhi.
- Kalaiselvi A (2017), "Attitudes and Purchasing Behavior Towards Consumer Durable Goods", International Journal of Applied Research, Vol. 3, No. 9, pp. 320-322.
- Karl G Joreskog and Dag Sorbom (1993), "Structural Equation Modeling with the SIMPLIS Command Language", Scientific Software International Inc., Chicago, IL.
- Landman J (1987),"Regret: A Theoretical and Conceptual Analysis", Journal for the Theory of Social Behavior, Vol. 17, No. 2, pp. 135-160.
- Marcel Zeelenberg and Rik Pieters (1999), "Comparing Service Delivery to What Might Have Been: Behavioral Responses to Regret and Disappointment", Journal of Service Research, Vol. 2, No. 1, pp. 86-97.
- Marcel Zeelenberg and Rik Pieters (2006), "Looking Backward with an Eye on the Future: Propositions toward a Theory of Regret Regulation", Judgments over Time: The Interplay of Thoughts, Feelings, and Behaviors, pp. 210-229.
- Marcel Zeelenberg and Rik Pieters (2007), "A Theory of Regret Regulation 1.0", Journal of Consumer Psychology, Vol. 17, No. 1, pp. 3-18.
- Marcel Zeelenberg, Wilco W Van Dijk, Antony S R Manstead and Joop van der Pligt (1998), "The Experience of Regret and Disappointment", Cognition and Emotion, Vol. 12, No. 2, pp. 221-230.
- Mark Heitmann, Donald R Lehmann and Andreas Herrmann (2007), "Choice Goal Attainment and Decision and Consumption Satisfaction", Journal of Marketing Research, Vol. 44, No. 2, pp. 234-250.
- Michael Tsiros and Vikas Mittal (2000), "Regret: A Model of Its Antecedents and Consequences in Consumer Decision making", Journal of Consumer Research, Vol. 2, No. 6, pp. 401-417.
- My Bui, Anjala S Krishen and Kenneth Bates (2011), "Modeling Regret Effects on Consumer Post-Purchase Decisions", European Journal of Marketing, Vol. 45, Nos. 7/8, pp. 1068-1090.
- Naresh K Malhotra and Satyabhushan Dash (2019), Marketing Research: An Applied Orientation, 7th Revised Edition, Pearson Education, Noida.
- Penny M Simpson, Judy A Siguaw and John W Cadogan (2008), "Understanding the Consumer Propensity to Observe", European Journal of Marketing, Vol. 42, No. 1, pp. 196-221.
- Peter M Bentler and Douglas C Bonnet (1980), "Significance Tests and Goodness of Fit in the Analysis of Covariance Structures", Psychological Bulletin, Vol. 88, No. 3, pp. 588-606.
- Philip Kotler, Gary Armstrong, Prafulla K Agnihotri and Ehsan ul Haque (2010), Principles of Marketing: A South Asian Perspective, 13th Edition, Pearson Education Private Limited, New Delhi.
- Rik Pieters and Marcel Zeelenberg (2005), "On Bad Decisions and Deciding Badly: When Intention Behavior Inconsistency is Regrettable", Organizational Behavior and Human Decision Processes, Vol. 97, No. 3, pp. 18-30.
- Robert Sugden (1985), "Regret, Recrimination and Rationality", Theory and Decision, Vol. 19, No. 1, pp. 77-99.
- Rudolf Anderson and Swaminathan Srinivasan S (2011), "Customer Satisfaction and Loyalty in E-Markets: A PLS Path Modeling Approach", Journal of Marketing Theory & Practice, Vol. 19, No. 2, pp. 221-234.
- Ruth C King, Richard A M Schilhavy, Charles Chowa and Wynne W Chin (2016), "Do Customers Identify with Our Website? The Effects of Website Identification on Repeat Purchase Intention", International Journal of Electronic Commerce, Vol. 20, No. 3, pp. 319-354.
- Seung H Lee and June Cotte (2009), "Post Purchase Consumer Regret: Conceptualization and Development of the PPCR Scale", Advances in Consumer Research, Vol. 36, pp. 456-462.
- Shelley E Taylor and Sherry K Schneider (1998), "Coping and Simulation of Events", Social Cognition, Vol. 7, No. 2, pp. 174-194.
- Shirang Altekar (2014), "A study of the Buying Decision Process with Reference to Select Consumer Durables", [Unpublished Doctoral Dissertation] Symbiosis International University.
- Shirang Altekar and Anil Keskar (2014), "A Study of the Factors Impacting the Buying Decision Process vis-a-vis Specified Consumer Durables in NOIDA", Journal of General Management Research, Vol. 1, No. 2, pp. 111-123.
- Suja Nair (2011), Consumer Behaviour in Indian Perspective, 2nd Edition, Himalaya Publishing House, Mumbai.
- Sung-Joon Yoon and Joo-Ho Kim (2000), "An Empirical Validation of Loyalty Model based on Expected Disconfirmation", Journal of Consumer Marketing, Vol. 17, No. 2, pp. 120-136.
- Teh-Wei Hu, Ming Li and Shangjin Wei (1989), "Household Durable Goods Ownership in Tianjin, China", The China Quarterly, Vol. 120, No. 6, pp. 787-799.
- Terry Connolly and Marcel Zeelenberg (2002), "Regret in Decision-Making", Current Directions in Psychological Science, Vol. 11, pp. 212-216.
- Terry L Boles and David M Messick (1995), "A Reverse Outcome Bias: The Influence of Multiple Reference Points on the Evaluation of Outcomes and Decisions", Organizational Behavior and Human Decision Processes, Vol. 61, No. 3, pp. 262-275.
- Wilco W V Dijk and Marcel Zeelenberg (2002), "Investigating the Appraisal Patterns of Regret and Disappointment", Motivation and Emotion, Vol. 26, pp. 321-331.