Aug' 21
The IUP Journal of Marketing Management
Archives
Does Promotional Mix Have a Long-Term Effect on Sales? A Case of the Pharmaceutical Industry in India
Somroop Siddhanta
Professor, Faculty of Management Studies, Dr. B. C. Roy Engineering College, Durgapur, India.
E-mail: rintuom@gmail.com
Mithun Kumar Guha
Assistant Professor, School of Management, Presidency University, Bengaluru, India; and is the corresponding author. E-mail: mithun.guha83@gmail.com
The study explores the effect of promotional mix on net sales in the pharmaceutical industry in India over time. The data for promotional mix and sales revenue was sourced from the Capitaline database. Both the above time series variables were subjected to log transformation to start with. Thereafter, correlogram analysis and stationarity testing were conducted, which was followed by the Johansen cointegration test. Since no long-term association was found in the cointegration test, the Vector Autoregression was performed. Finally, tests for Impulse Response Function and Forecast Error Variance Decomposition were administered on both the variables. The results indicate a positive effect of promotion mix on net sales with a lag of one year.
Introduction
The challenge for any business organization is to select the right mix of promotional activities which suits the business at a given point in time so that it achieves the desired result. Thus, every organization should have a mix of proper and tightly supervised promotional activities to boost the sales revenue, thereby increasing the profit of the organization (Adebwasi and Babatunde, 2011). There are certain objectives that are kept in mind while marketers develop their promotion mix. Potluri (2008) reiterated that one of the main objectives of marketing communication is the ability to spread awareness by informing prospects with relevant information, which would develop favorable attitudes within them that may lead to brand loyalty. A wide gamut of studies have explored the effect of promotional mix on sales revenue, retained earnings, return on investment, and market capitalization. Most of the studies have been conducted for a particular firm. But so far as studies at the industry level are concerned, the number is limited to a few. One of the drawbacks of such studies conducted for a single organization is that it is difficult to generalize the results obtained for the industry as a whole (Siddhanta and Banerjee, 2014). In fact, a body of literature suggested that a macro level analysis is better in estimating micro level effects. Little (1979) and later Guo (2003) both advocated the above, that through aggregate or macro level models one can have a good approximation of results at the micro level. The Indian pharmaceutical industry invests in long-term brand building activities like sharing latest studies with doctors, sponsoring them to conferences and short-term tools like physician detailing expenses and sales promotion tools, viz., trade discounts and allowances (Siddhanta and Banerjee, 2013). The application of such promotional strategies in the pharmaceutical industry has a strong effect on the physician's prescribing behavior which results in sales (Alowi and Kani, 2018). The present study tries to find answers to the question as to whether promotional mix budget allocations have a positive and long-term effect on net sales in the Indian pharmaceutical industry.
The pharmaceutical industry was chosen for the reason that it has healthy growth rates. Any industry growing at close to double-digit growth rates or above attracts new firms into it and the increase in competition thus achieved gives a fillip to the promotional spending across the firms in the industry. The Indian pharmaceutical industry is at present growing at 9.8% year-on-year as per the India Brand Equity Foundation Report (2020). The Indian pharmaceutical sector is expected to expand to $100 bn by the end of 2025, and is likely to be among the top 10 global spender of medicine within the same timeframe. A Bloomberg Quint Report (Mehta, 2019) pointed out that the top ten firms in the industry have a market share between 8.07% and 2.93% with a maximum gap of less than 2% between them, which implies how much fragmented the industry is with most of the big names in the industry in a neck and neck competition, and considering such high growth rates in the industry, the budget allocation for promotional mix of the pharmaceutical firms becomes a critical decision for the managers. This is the driving force behind conducting the current study, which endeavors to ascertain the nature and magnitude of relationship shared between promotional mix elements and net sales in the pharmaceutical industry through the application of standard econometric tests on the variables under study.
Literature Review
In the past, a plethora of research studies have been carried out in various countries around the world with an objective to seek the impact of promotional mix elements on various variables of corporate performance including sales in the pharmaceutical industry. A few select studies conducted in the last two decades have been discussed here.
Ma et al. (2003) studied the nature of promotion mix of pharmaceutical products in the US and found that a majority of the expenditure is on free samples, followed by office promotions, both of which are sales promotion tools. They also discovered that half of the promotional expenditure is on 50% of the top drugs which affects the prescribing behavior of these medicines in a big way. Two promotional mix variables, viz., doctor detailing and direct-to-consumer promotions, were considered in a study by Narayanan et al. (2004) in the US to see the effects of these elements on sales. They found that both these tools increase the market share of the brands significantly. Moreover, a micro level analysis suggested that detailing gives higher returns than direct-to-consumer promotions in the long run.
That detailing to physicians have higher promotional elasticity than the elasticity of direct-to-consumer promotions was also reflected in another study on the effectiveness of pharmaceutical promotional tools by Kremer et al. (2008), where they also found out that the effectiveness of these promotional tools depend on the disease category as well. Indian studies like the one by Pokharel (2017) also concurred with the above findings that physician detailing is the most effective promotional tool out of all the promotional mix elements, followed by sampling.
In another study conducted by Shah et al. (2017) in Pakistan, it was found that promotional spending has positively influenced the prescription behavior of physicians in general. The results further revealed that out of the various promotional mix elements, viz., reminder gifts, drug samples, academic detailing, medical educational programs, reminder gifts returned the highest promotional elasticity. A similar research study in Kenya by Pascal and Chukwuonye (2017) uncovered that the most popular promotional tools used there was giving away branded stationeries as reminder gifts.
It has also been found that promotional elasticity of pharmaceutical products depend on the respective drug's product lifecycle. Wieringa and Leeflang (2013) observed that promotional spending has minimal influence on the sale of established brands whereas it affects sales of the new brands significantly. They attributed this to the prescribing behavior of the physicians in the Netherlands, where new launches through sizeable marketing budgets get more prescriptions due to diffusion of the newly innovated brand while prescriptions of existing brands lag behind.
Objective
The objective of the study is to find the positive and long-term effect of promotional mix (designated hereafter as PROMOMIX) on Net Sales (designated hereafter as NTSALES) in the Indian pharmaceutical sector.
Methodology
For the study, secondary time series data with regard to PROMOMIX and NTSALES in the pharmaceutical sector in India during the period spanning ten years (April, 2009 - March, 2019) was considered. The data retrieved was quarterly in nature for the above mentioned time period and while extracting the data it was ensured that firms with missing data were not considered.
The data was recovered from Capitaline database owned by the firm Capital Market Publishers India Pvt. Ltd. This database has firm level data for close to about 10,000 companies that are listed in the Bombay Stock Exchange (Kathuria, 2008). A number of empirical studies, including Rakshit (2006), and Das and Samanta (2013), have been conducted by retrieving data from the said database.
For the analysis of the time series data, the software packages Gretl (GNU Regression, Econometrics and Time Series Library, and EViews were used.
Time series data represents a series of values that are generally spaced at equal time intervals. Time series analysis in marketing communications is commonly used to study the nature of influence, whether short-term or long-term, of marketing efforts on various parameters like sales, profits, return-on-investment, and so on. Such techniques have also been used to calculate the advertising elasticity, whether positive or negative, in many research studies in this field mainly to understand the type of effect that marketing communication may have on variables like sales, profits, etc. Three types of models, viz., univariate, multivariate and multiple are predominantly used in analysis of time series data. When variables depend mainly on their own past values, it is said to be a Univariate model. The Autoregressive Integrated Moving Average (ARIMA) model is the most commonly used model in this category. When the dependent variable at a particular time can be estimated by past values of itself as well as the independent variable, it is referred to as a Multivariate model. The Vector Autoregression (VAR) modelling falls under multivariate modeling techniques. Finally, models with endogenous variables like Vector Error Correction (VEC) belong to multiple time series modeling.
A stationarity test is the starting point for any time series analysis. A time series is strictly stationary if for any given integer 'n' and for any set of subscripts, t1, t2,..., tn the joint distribution of the stochastic process Xt, (Xt, Xt1, Xt2, . . . ,Xtn) depends only on
t1 - t, t2 - t,� tn - t but not on t. One of the basic tests for stationarity is the correlogram analysis which is done with the help of a Sample Autocorrelation Function (SACF). An autocorrelation at lag 'k' when plotted against lag 'k' results in a graph called the Correlogram (Chatfield, 1996). The SACF at lag k can be expressed as ...(1)
where is the ratio of sample covariance at lag k to sample variance, the value of which lies between -1 and +1. In general, stationary time series have autocorrelation values close to zero, whereas non-stationary time series have higher values that converge towards zero.
The variables, after log transformation to reduce biasness, were subjected to further stationarity testing through Augmented Dickey-Fuller (ADF) test, Philips-Perron (PP) test and the Kwiatkowski-Philips-Schmidt-Shin (KPSS) test.
The ADF test equation as per Engle and Granger (1987) is written as
...(2)
where Yt is the dependent variable, et is the error, and k is the number of lags. Here, non-stationarity of the variable Yt is considered as the null hypothesis, which is rejected if the t-values of the ADF test are significantly less than the critical values. Testing of stationarity was also done with the help of Philips-Perron (1989) test. The PP test equation can be represented as,
...(3)
where Yt is the dependent variable and et is the error term. Akin to the ADF test, the null hypothesis is non-stationarity of the series Yt. In case of the KPSS (Kwiatkowski et al., 1992) test, the null hypothesis changes to 'stationarity'. The KPSS test equation is shown below
...(4)
where r is the ratio of 'normalized sum of squared partial sums' and the 'constant estimate of the long-run variance'. The test statistic value is checked as to whether it is higher than the critical value, in which case the null hypothesis of 'stationarity' is rejected.
After checking for non-stationarity of the variables, they are checked for the presence of cointegration. The presence of cointegration implies long-term relationship between the two time series, NTSALES and PROMOMIX, in which case the VEC model need to be estimated. The absence of cointegration is suggestive of prediction of the VAR model.
Since long-term relationship between two variables can be studied better by testing for cointegration, the same was performed on PROMOMIX (Equation 4a) and NTSALES (Equation 4b). However, it is important to know whether these two time series variables used in the study have a deterministic or stochastic trend. For instance, if NTSALES has a deterministic trend then PROMOMIX cannot have an effect on it in the long run. Instead, PROMOMIX can only have a temporal effect, since in the end NTSALES will return to its pre-determined growth path. But if both NTSALES and PROMOMIX show a stochastic trend then the two variables may be cointegrated and share a long-term association. Cointegration thus implies the presence of a stationary linear combination of two or more non-stationary time series variables (Gujrati and Sangeetha, 2007). If the variables PROMOMIX and NTSALES are cointegrated, they cannot move too far away from each other. In contrast, a lack of cointegration suggests that such variables have no long-run link, in principle, they can wander arbitrarily far away from each other (Dickey,
et al., 1991).
A cointegration test is preceded by the lag length selection of both the time series taken together and is commonly calculated by using the VAR lag order selection procedure, which has been used in this study as well. An optimum lag length selection decision is done by checking the minimum values of Akaike Information Criterion (AIC) and simultaneously the significance of p(LR).
Post the identification of lag order, Johansen test for cointegration was conducted. Johansen (1988) proposed a VAR framework with 'p' dimensions and k lags as
...(5)
where Yt is a (p x 1) vector of p endogenous variables, O1, O2 are (p x p) matrices and et is the error term. Johansen and Juselius (1990) argue that the above test of cointegration will lead to the result 'no cointegration' when the value of O is zero. In such a situation, a VAR model of the time series variables is estimated in their first differences. If it comes out to be full then both the time series can be considered stationary and a VAR in levels need to be done. If the above Johansen cointegration test returns a value of O between 1 and (p - 1), then there is presence of 'cointegration' and thus the VEC model estimation is done by the below mentioned equation,
...(6)
where D refers to the difference operator, P and q are (p x p) matrices, k is the lag length, et is the error term and Ok represents the speed of adjustment from disequilibrium.
In a bivariate VAR, since both the variables are endogenous, there exists feedback relationships among the equations. So, the Impulse Response Function (IRF) and Forecast Error Variance Decomposition (FEVD) are analyzed to have clarity on the feedback relationships of the variables, PROMOMIX and NTSALES to shocks in different time periods. Since these shocks or innovations also may be correlated, the estimated VAR model is orthogonalized using Cholesky decomposition and then the IRFs are estimated (Pesaran and Shin, 1997). The orthogonalized IRF thus estimated shall then be useful in determining the effects of change in PROMOMIX on NTSALES and vice versa over a certain time period (Dekimpe et al., 1999).
Hamilton (1994) argued that before orthogonalization of IRFs, the VAR model must first be transformed into a Moving Average (MA) form as below
Yt =a + e t +1 e t-1 +2 et-2 + ...+p et-p
where s shows the effects of a one unit change in the jth variable's shock at time t(ejt) for the value of the ith variable at time t + s, assuming all other shocks constant. Thus, IRF is the plot showing row i, column j element of s as a function of s, and portrays the behavior of Yi, t+s to a one-time shock in Yjt with all other variables at t or earlier held constant.
Results and Discussion
The variables under study, PROMOMIX and NTSALES were transformed to their logarithmic counterparts. The transformed variables, viz., LNPROMOMIX and LNNTSALES respectively were not stationary but their first differences, DLNPROMOMIX and DLNNTSALES were found to be so. A Correlogram analysis was conducted to check the stationarity of the variables mentioned above and the presence of a deterministic trend. The results are shown in Figure 1 for LNPROMOMIX and in Figure 2 for LNNTSALES.
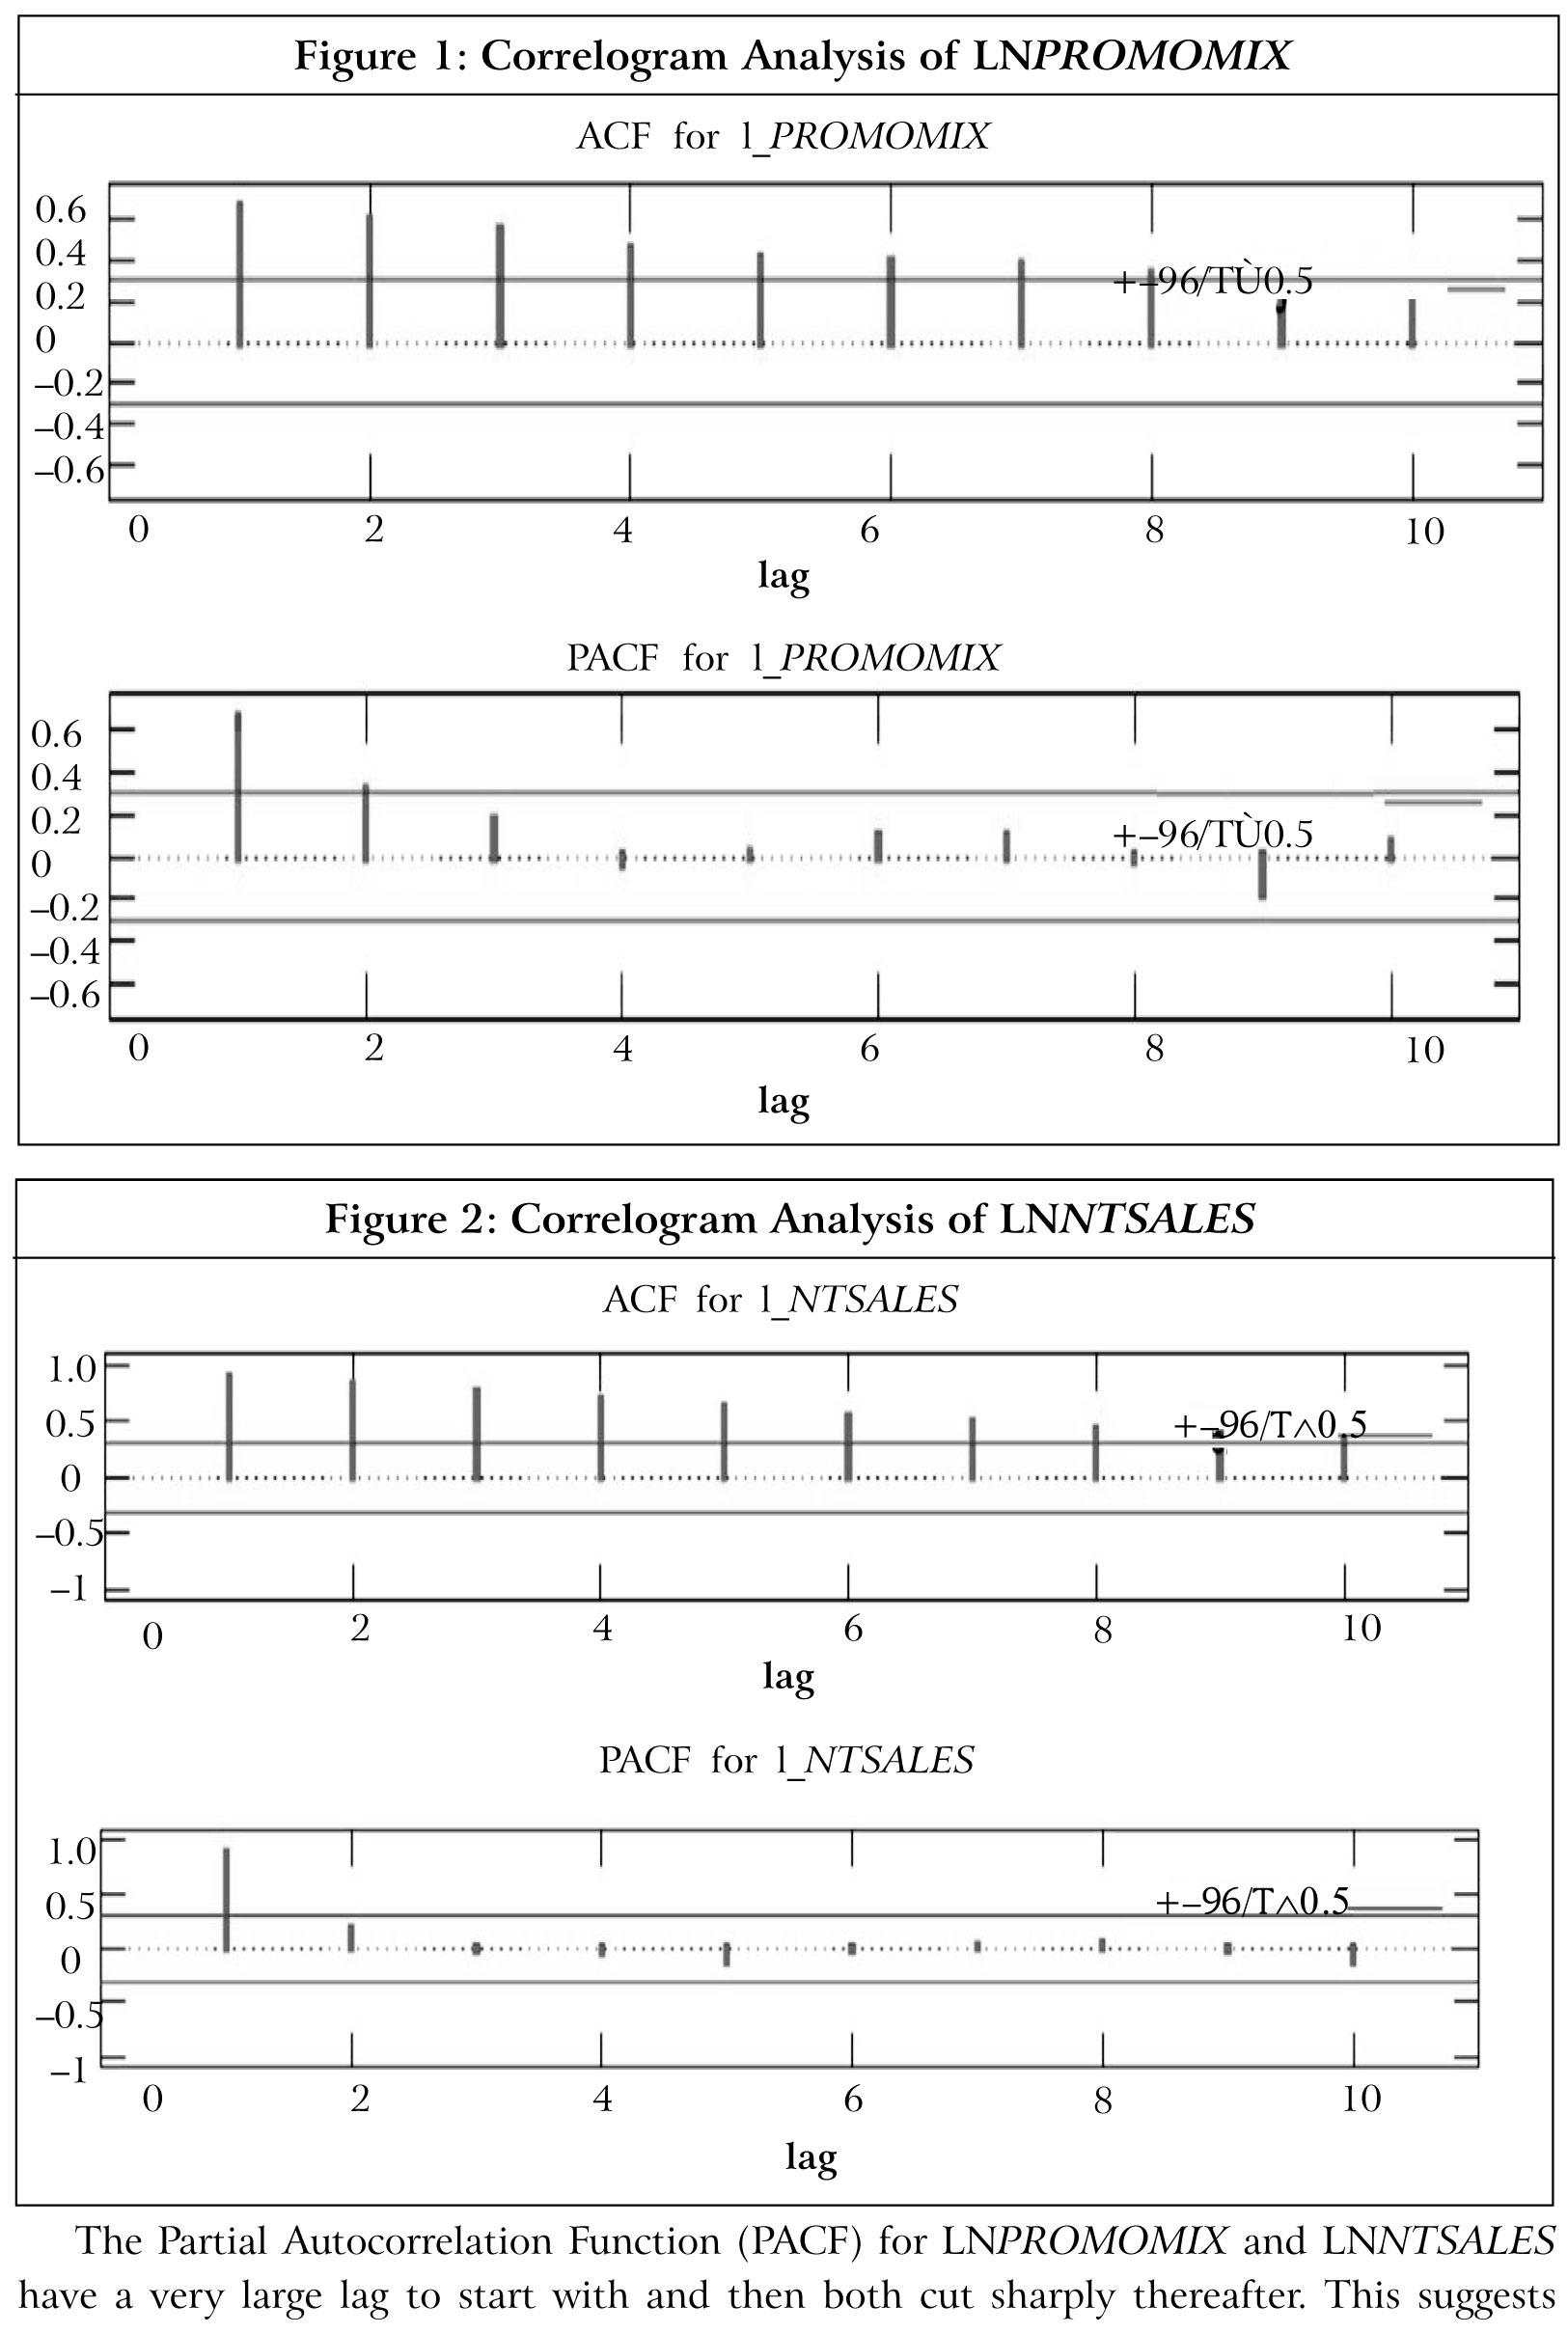
that both the series are difference-stationary and there is no deterministic trend. The PACF results further indicate that LNPROMOMIX is autoregressive of order two, i.e., AR (2) while LNNTSALES is AR (1).
The two time series variables LNPROMOMIX and LNNTSALES were subjected to unit root tests. As discussed in the Methodology section, the ADF, PP and KPSS tests were conducted for the analysis. Table 1 shows the results of these unit root tests.
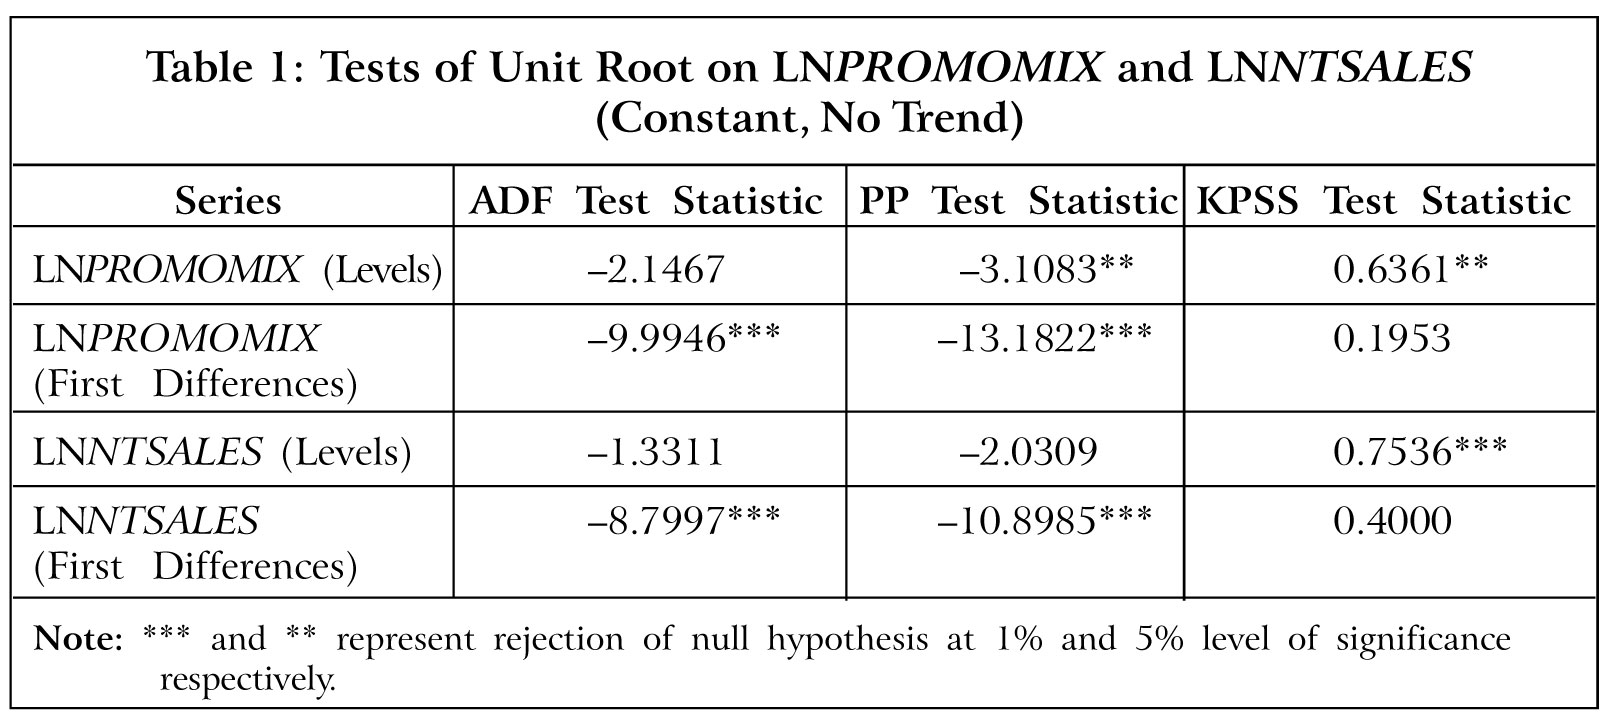
Both LNPROMOMIX and LNNTSALES are stationary at their first differences as per the ADF and PP test results which reject the null hypothesis at 1% levels. The same is confirmed by the KPSS test, the result of which rejects the null hypothesis of stationarity at 5% for levels of LNPROMOMIX and at 1% for levels of LNNTSALES. Consequently, both LNPROMOMIX and LNNTSALES are I(1) or integrated of the first order. This means that these two variables might be related in the long-run. Subsequently, the first hypothesis of the study can be stated here as follows:
H1: There will be long-term effect of PROMOMIX on NTSALES in the pharmaceutical industry in India.
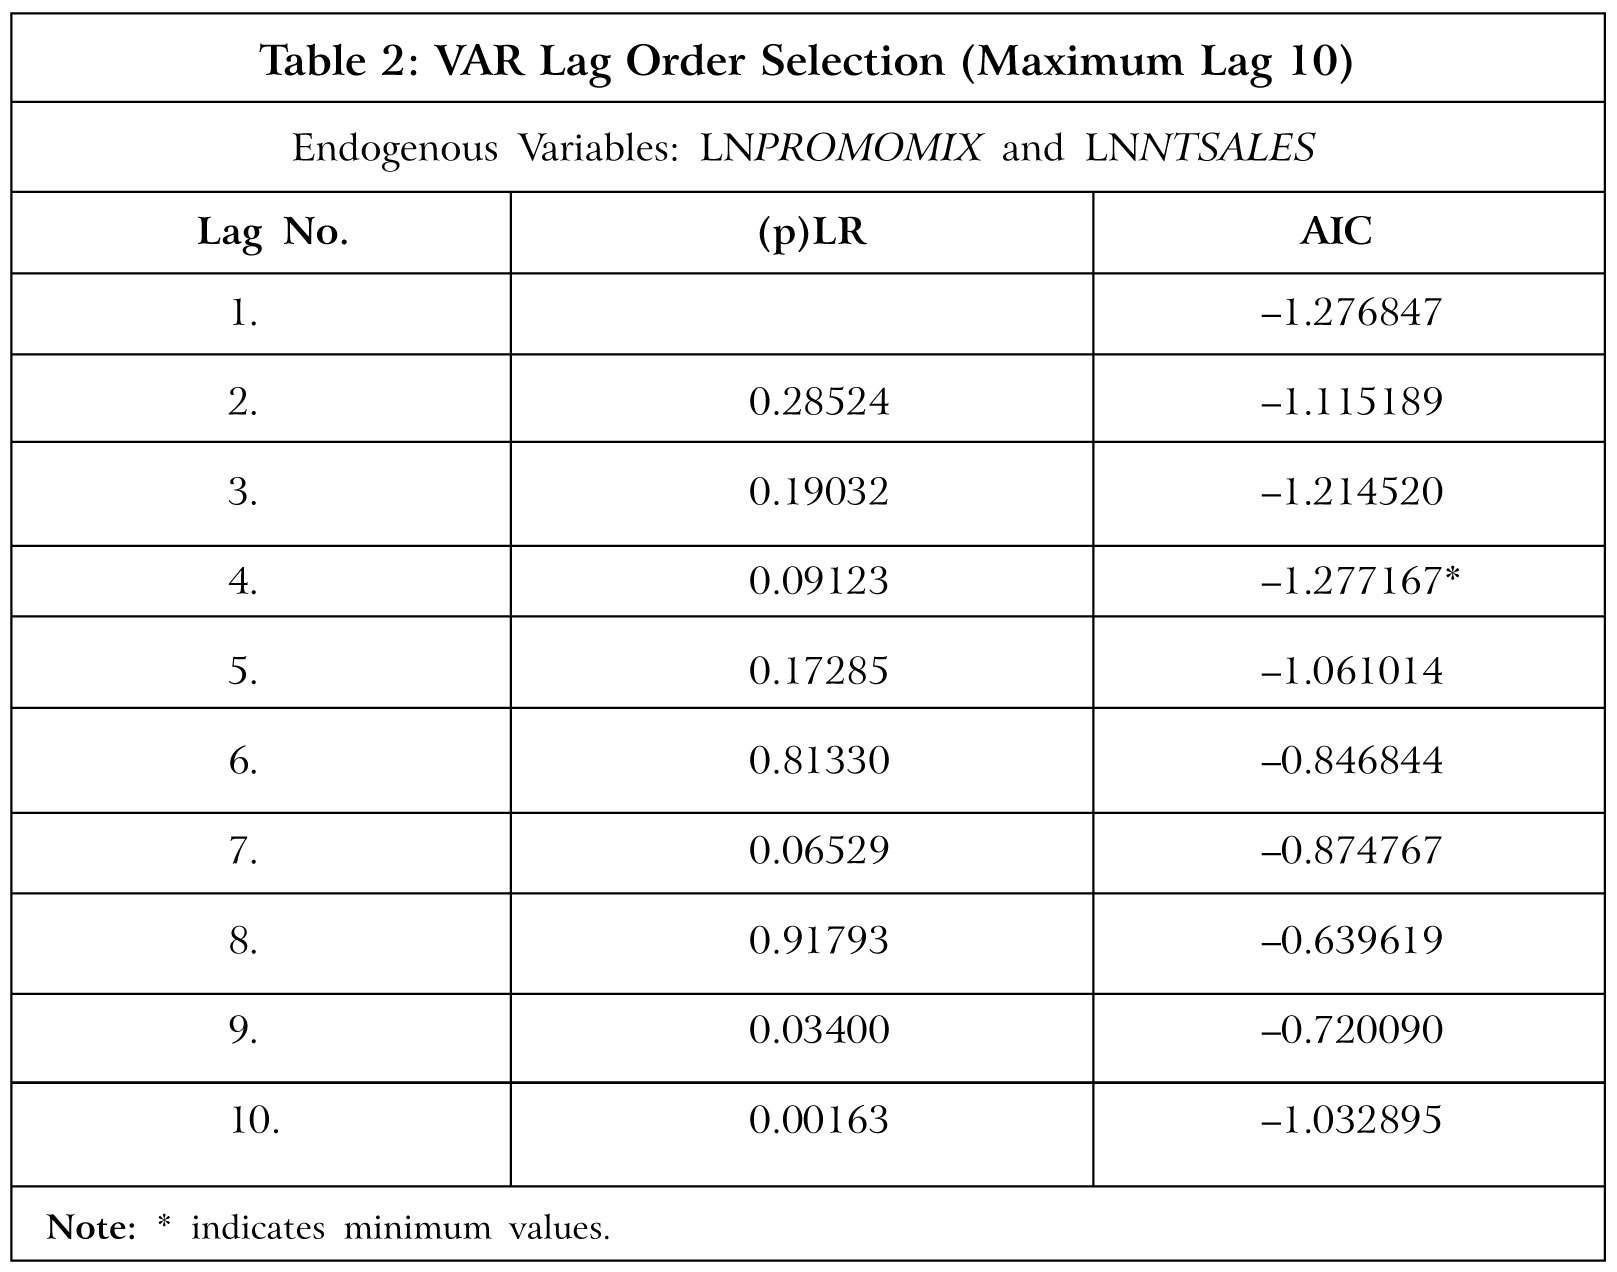
A cointegration test is carried on to ascertain the long-term effect of one variable on another. In this study, the same was done by applying the Johansen test for cointegration. A necessary prelude to the Johansen test is determining the lag length. Therefore, the VAR lag selection technique was applied at 10 lags which is one-fourth of the number of observations. To find the optimum lag length, the minimum AIC value may be taken into consideration as Liew (2000) found out that for small samples (60 observations and below), the AIC is superior to other criterions as it minimizes the chance of under estimation. Also, in a study by Kilian (2001), it was found that in finite lag order, VAR models, the use of the AIC tends to result in more accurate point and interval estimates. The results of VAR lag selection as summarized in Table 2, indicates that the optimum lag can be taken as '4'.
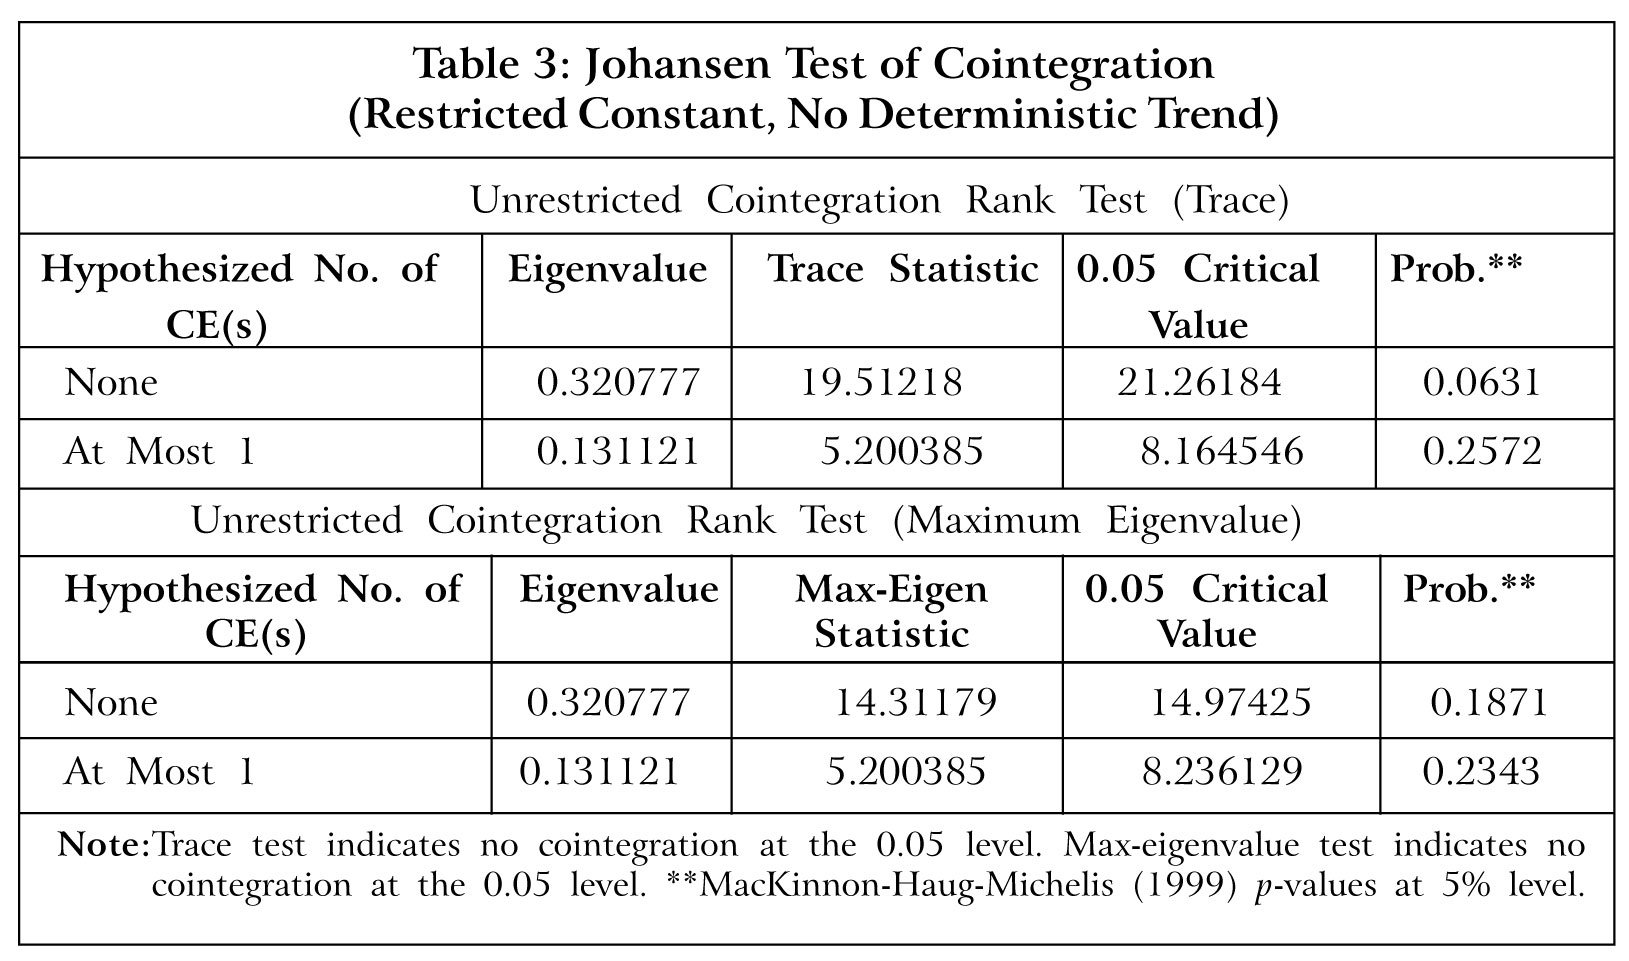
The Johansen cointegration test was carried out on LNPROMOMIX and LNNTSALES after ascertaining the optimum lag as '4'. The Johansen test returns both Trace and Maximum Eigenvalue statistics and the presence of a long-term association can be verified by checking the corresponding critical values at 5% levels. The Johansen test results of LNPROMOMIX and LNNTSALES are summarized in Table 3.
Since both the trace and maximum eigenvalue statistics are less than the critical values, the null hypothesis of 'no cointegration' cannot be rejected. It can thus be argued that there is no long-term association between LNPROMOMIX and LNNTSALES. Based on the above results which suggests that there is no long-term association between PROMOMIX and NTSALES in the pharmaceutical industry in India, H1 can therefore be rejected.
The second hypothesis can now be stated as follows:
H2: There will be positive effect of PROMOMIX on NTSALES in the pharmaceutical industry in India.
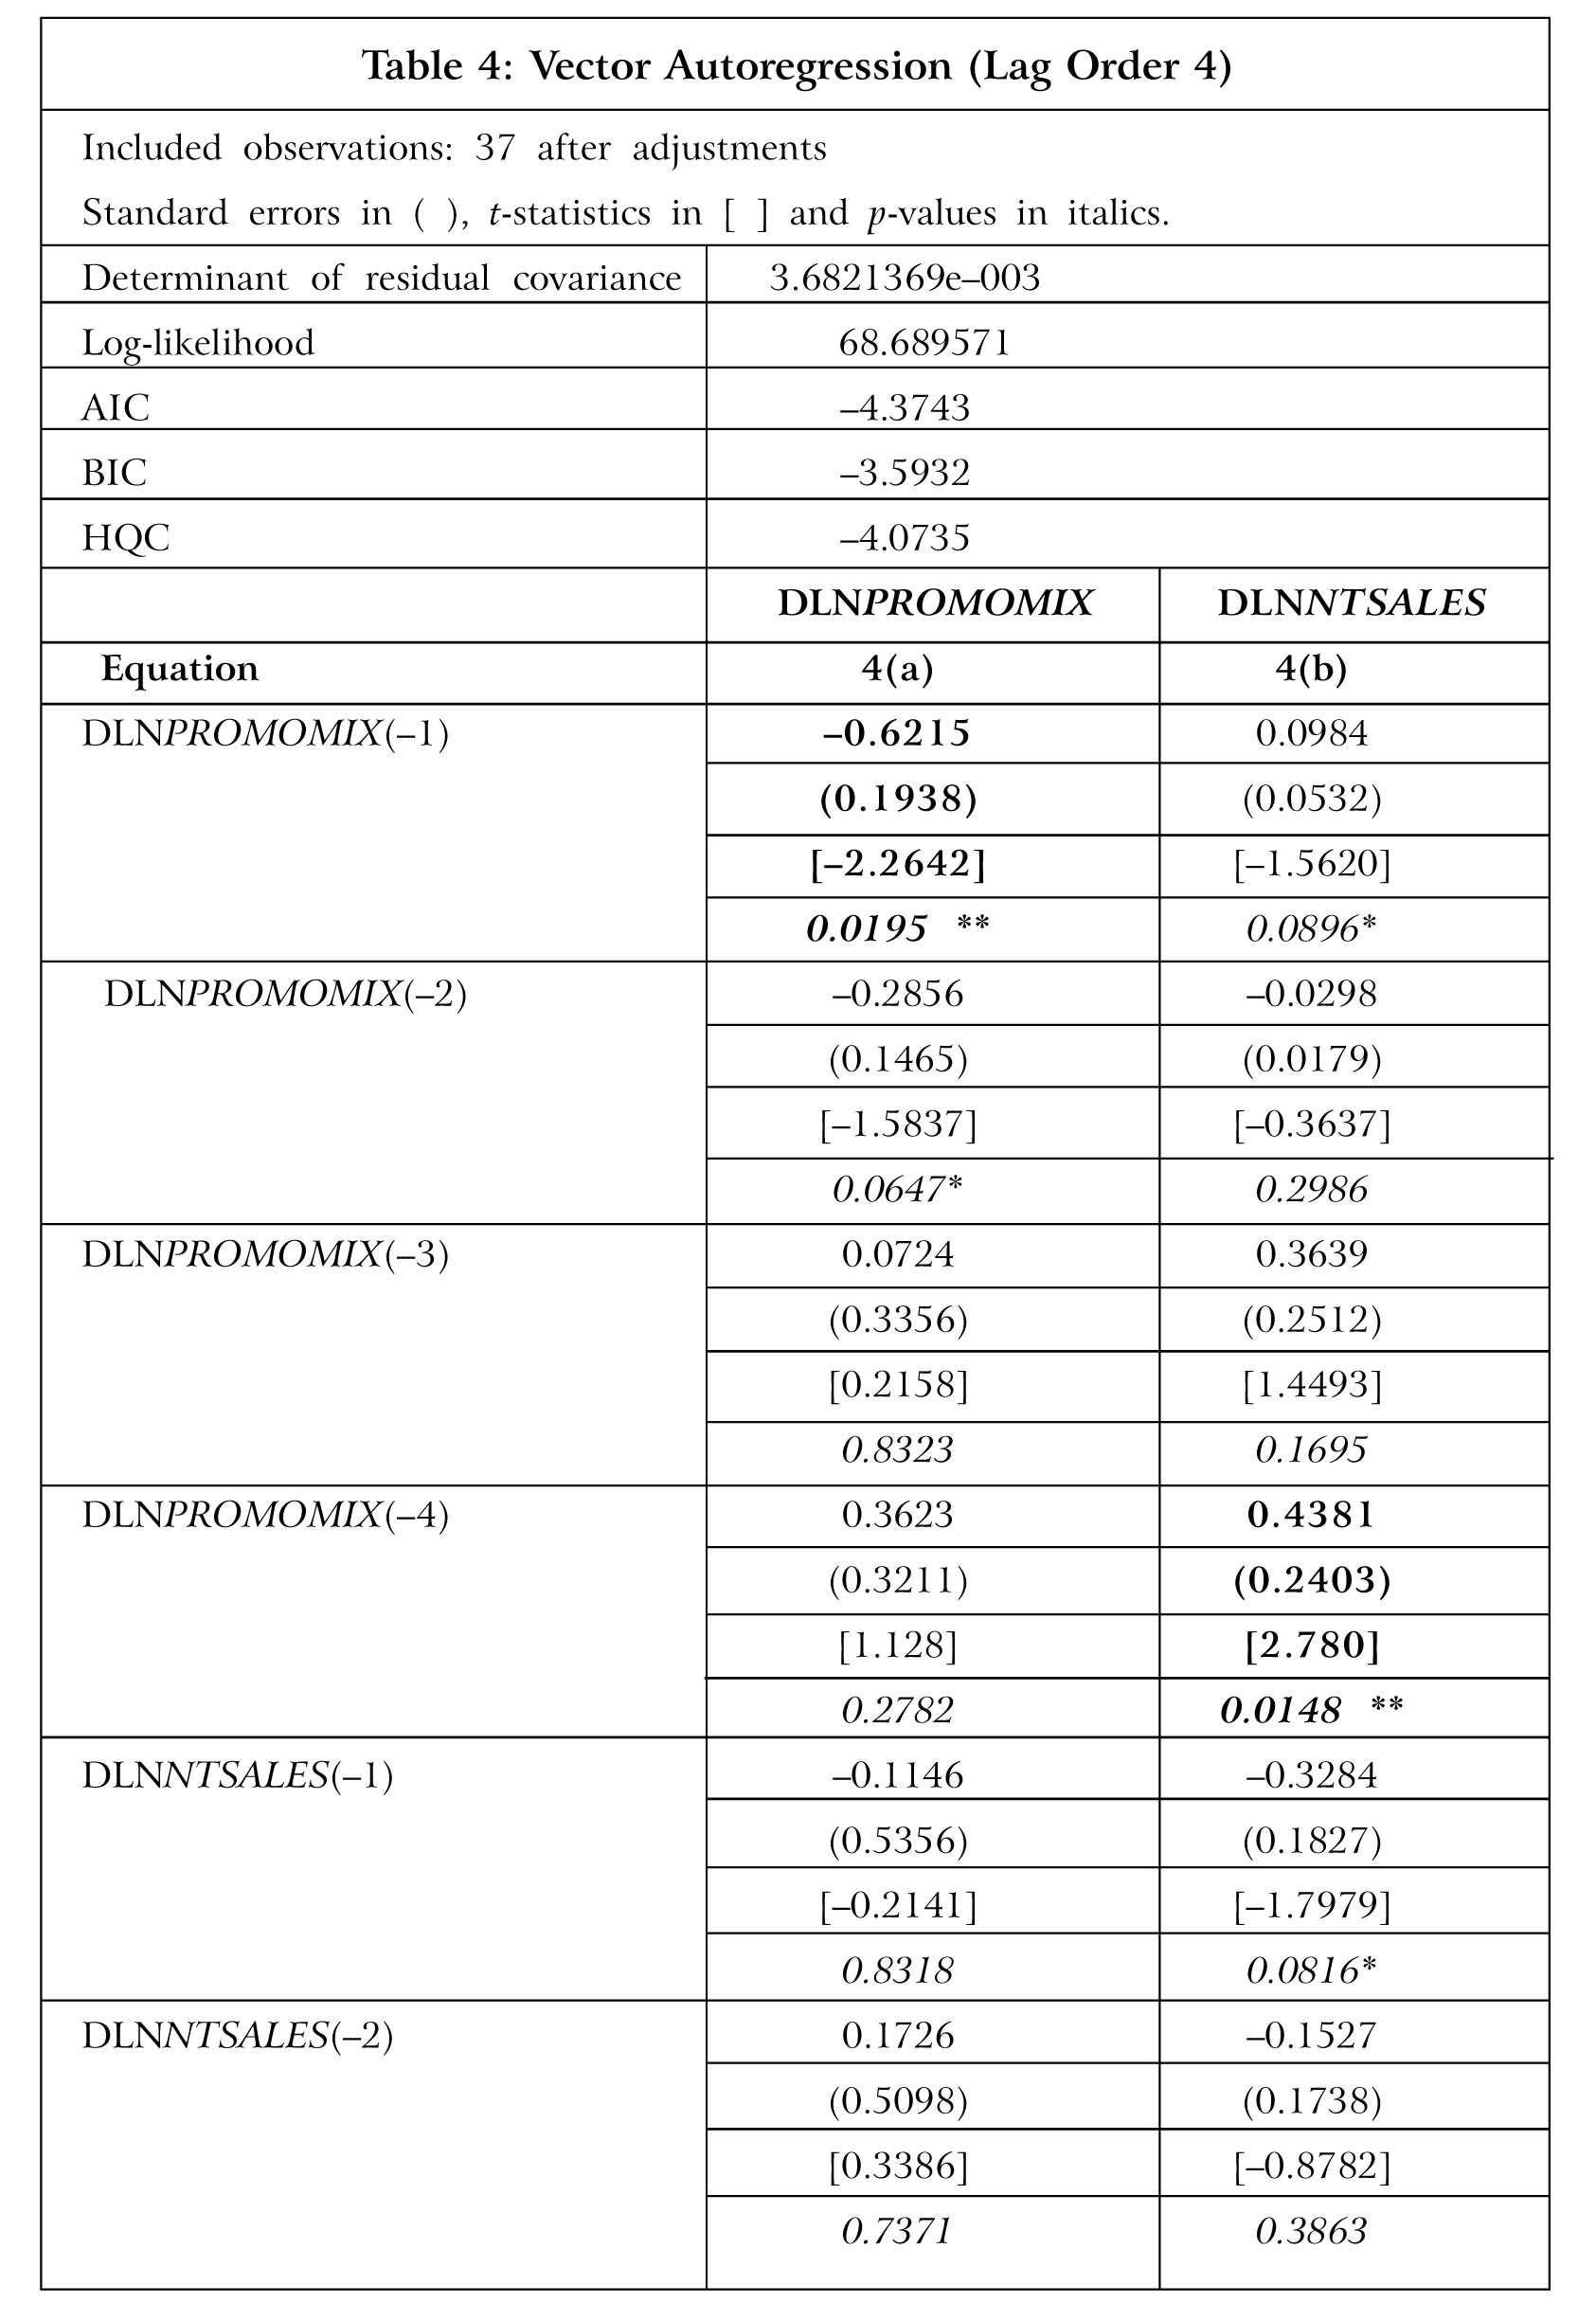
As already discussed in Methodology, the absence of cointegration necessitates the estimation of a VAR model in first differences. As a result, the first differences of both LNPROMOMIX and LNNTSALES are arrived at and a VAR is run at lag four on both DLNPROMOMIX and DLNNTSALES, where these differenced variables act as endogenous variables. The VAR estimation model result is depicted in Table 4.
The VAR results show that both PROMOMIX and NTSALES have significant
F values. Also, the Durbin-Watson statistic, which is a measure of the amount of autocorrelation, is close to '2' in both the equations. Thus, the regression results are not affected by autocorrelation. VAR results of PROMOMIX (Equation 4a) suggest that lagged promotional expenses of one quarter has a significant inverse impact on current promotional budget which is evident by the high t-value of -2.2642 which is significant at 5% level. It may thus be argued that the industry seems to reduce promotional spending if it has stepped up the same in the earlier quarter. The result of VAR NTSALES (Equation 4b) is interesting as at lag 4, the t-value is significantly high at 2.780. Hence, it may be concluded that DLNPROMOMIX at lag 4, i.e., one year back has a major positive impact on DLNNTSALES. In other words, an increase in LNPROMOMIX by a firm in the last year increases LNNTSALES in the current year by a magnitude 0.4381 and the same is significant at 5% level. Thus, there will be an increase in sales as a result of increase in promotional budget and the magnitude of such an increase shall be about one-half. Thus, the increase in promotional expenses in the last year is likely to have a less than proportionate increase in sales revenue in the current year. The findings are consistent with earlier studies, viz., Kremer et al. (2008) and Alves et al. (2019) where it has been found that there are positive effects of promotional expenditure on sales of pharmaceutical products with the former study pointing out that promotional elasticity, which is a change in sales due to one unit increase in promotions, have been found to be substantially less than unity.
On the basis of the results, it can be stated that there is positive effect of PROMOMIX on NTSALES in the pharmaceutical industry in India. H2 can therefore be accepted.
The nature of change in NTSALES due to a change in PROMOMIX one year back can be further studied by IRF and FEVD. The IRF shows the impact of a change in one variable whereas the FEVD measures what proportion of the future changes are due to the past changes, in this case one year. To ensure that the error terms are not correlated, the orthogonalization of IRFs are done by Cholesky decomposition. Figure 3 shows the orthogonalized IRFs.
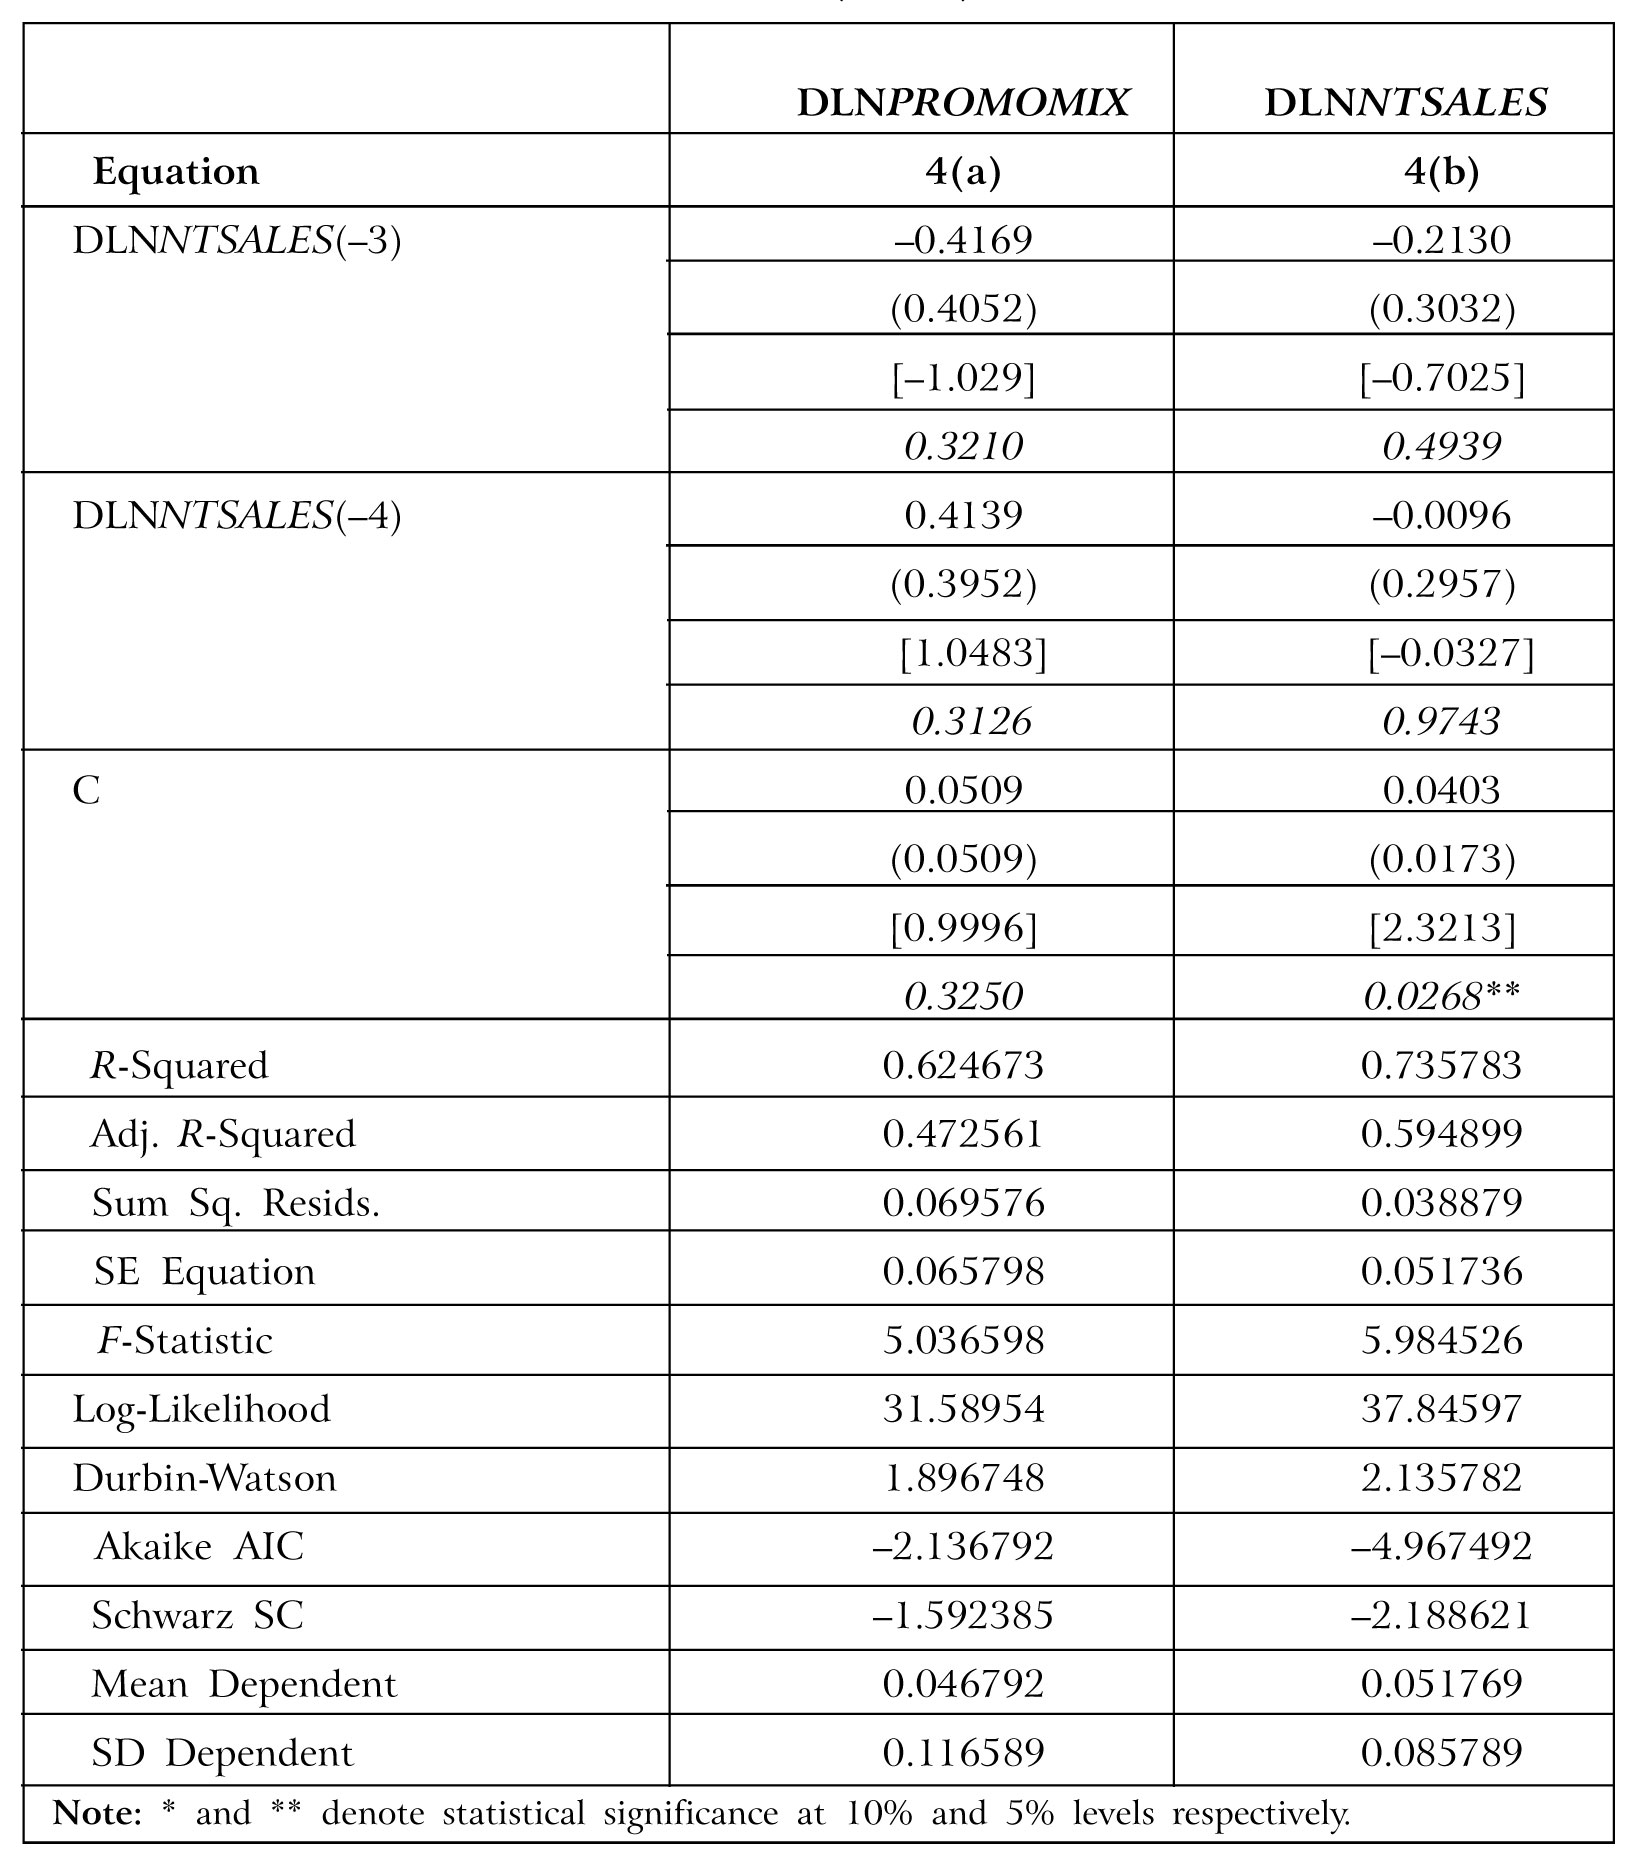
In the figure, it can be seen that DLNPROMOMIX, i.e., a change in PROMOMIX expenses have a positive impact on DLNNTSALES, i.e., change in NTSALES after 4 time lags which is consistent with the findings of the VAR model, whereas a change in NTSALES does not have any impact on change in PROMOMIX as the curve maintains the flat trajectory throughout. Also evident from the IRF is the fact that there is a high negative value of LNPROMOMIX after one time period to a shock by LNPROMOMIX itself, as the VAR result of PROMOMIX suggests inverse relationship between current and past quarter promotional expenditures.
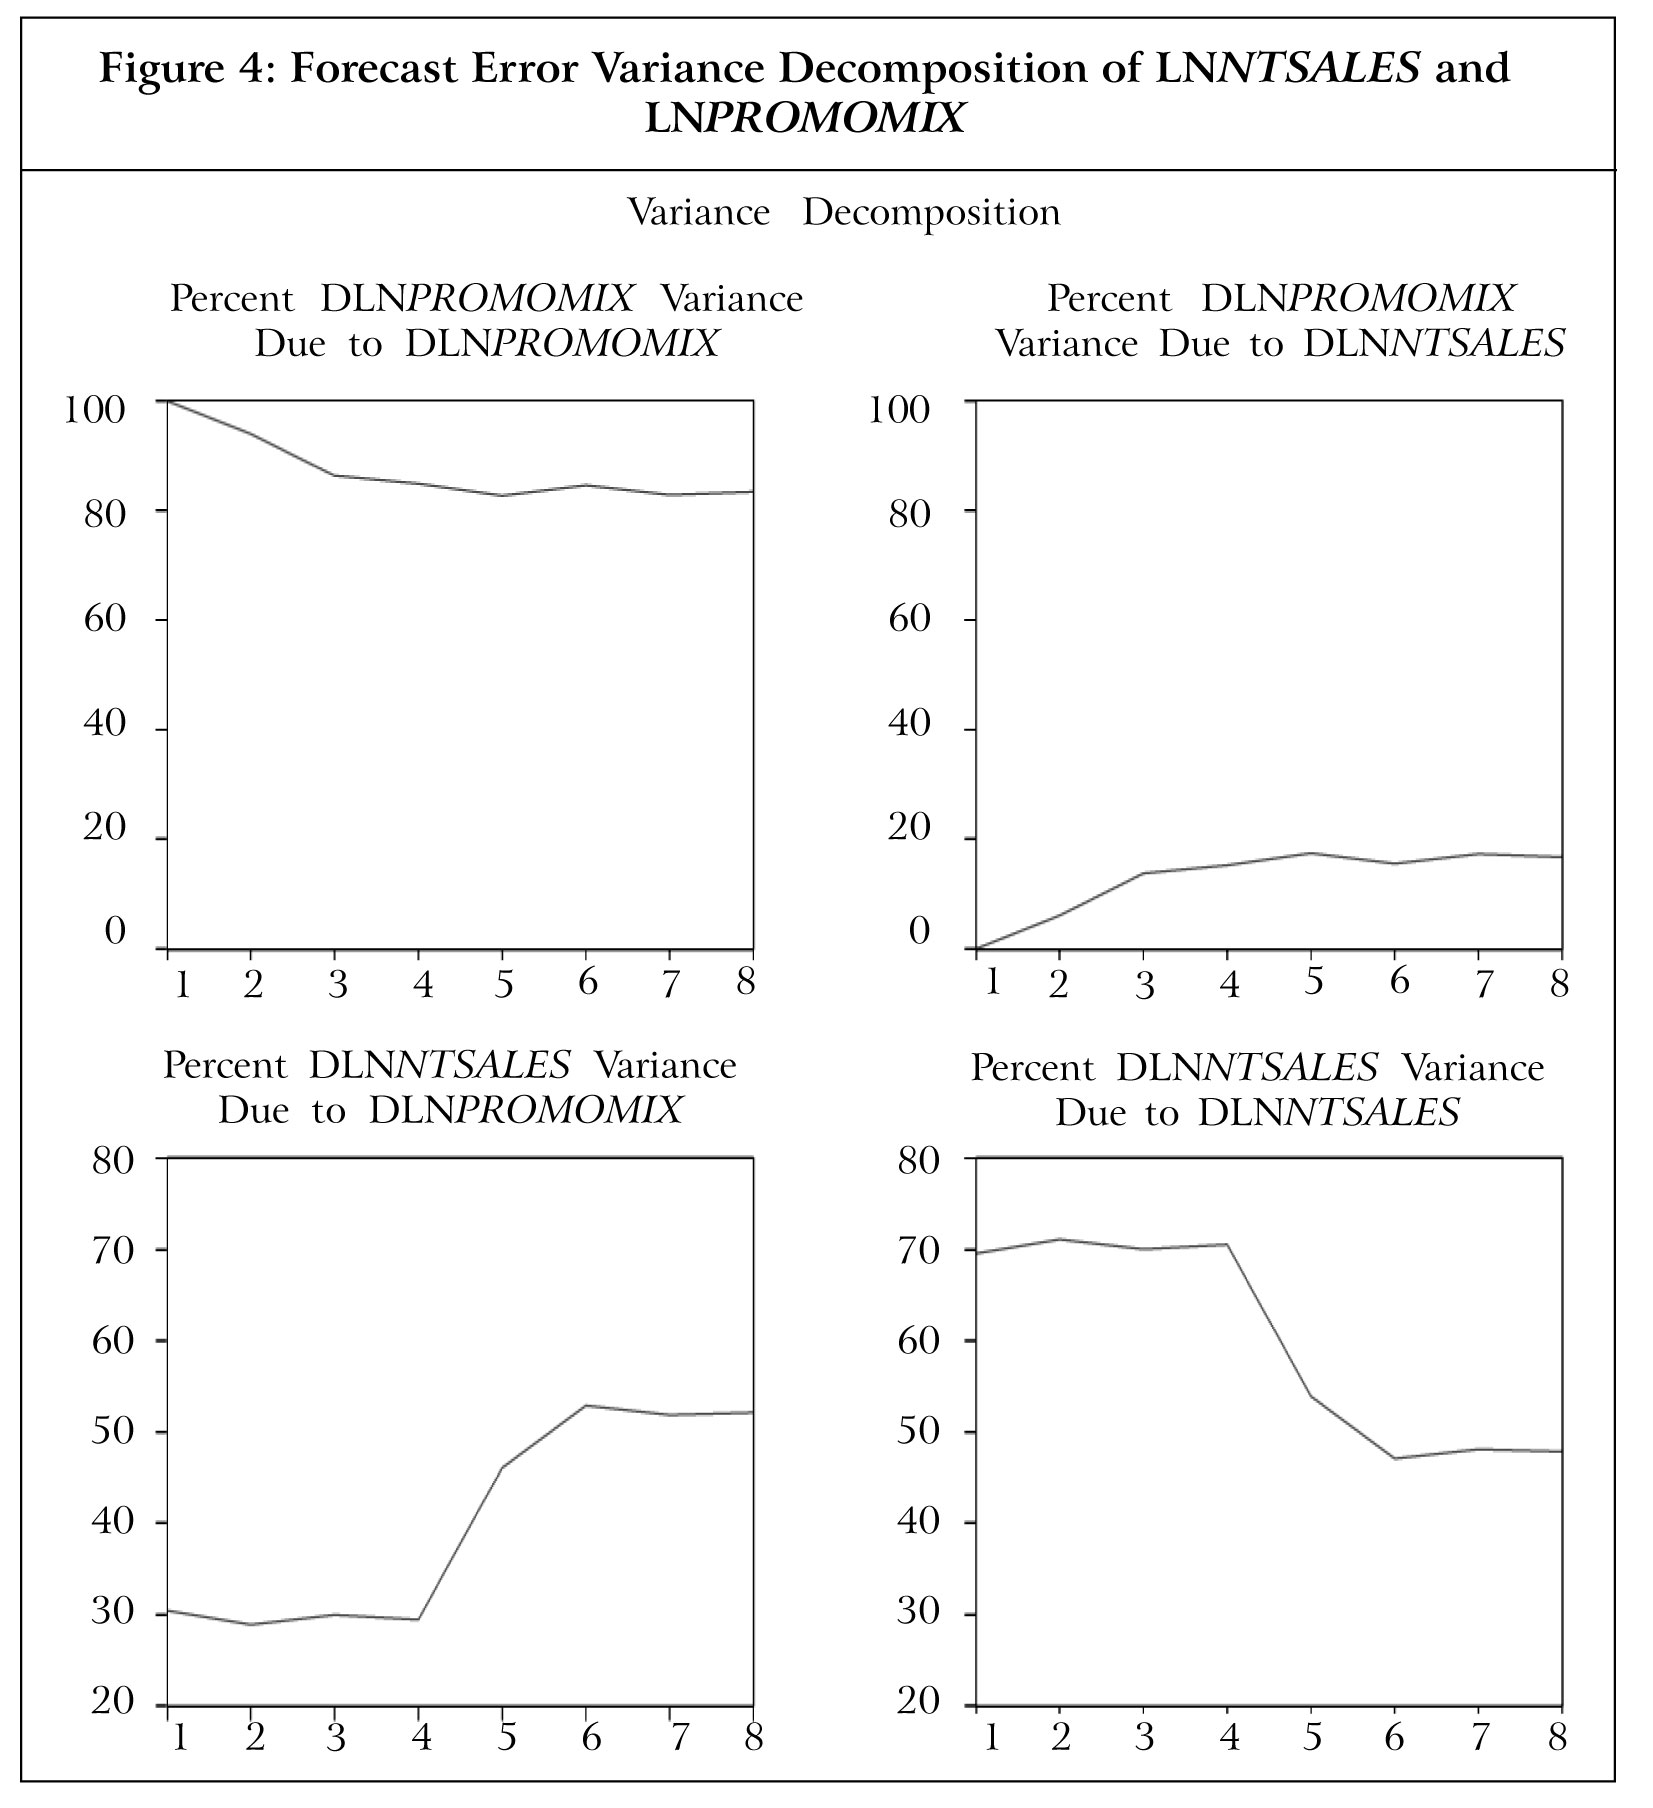
The FEVD analysis was conducted to ascertain the proportion of the variations to the variables in future due to the innovations introduced. The same is shown in Figure 4.
The FEVD analysis from the figure shows that only about 45% of change in NTSALES after one year, i.e, four quarters hence is due to changes in PROMOMIX. This once again reflects the VAR model result that a change in promotional spending has an effect on change in sales revenue but in effect only about 45% variation in sales is explained by variation in promotional mix.
Implications: For pharmaceutical firms in India, the results reveal that there is an absence of cointegration and therefore of any long-term relationship between promotional mix and net sales. However, a positive relationship between promotional mix one year back and present net sales could be established. The effect of an increase in sales due to an increase in promotional mix though, was found to be less than proportionate since the promotional elasticity was calculated as 0.4381. Since the effect of promotion mix on net sales is positive but less than proportionate, decision makers should also focus on other P's of marketing mix like pricing, and availability to generate sales revenue, as they are equally responsible for doing so rather than over relying on promotions. Moreover, the magnitude of the regression coefficient also gives managers an idea as to how much budget allocation in promotional mix is required to achieve the desired goal/s.
In case of the pharmaceutical sector, the customers are the doctors who prescribe the products looking at the safety and efficacy of the drug. The promotions are targeted at them both in hospitals and in their clinics through personal selling efforts of salespeople. Due to the ever-increasing competition in the industry, new product launches, reduction of in-clinic time, and the subsequent clutter thereof, healthcare professionals take time for brand names getting registered in their mind. It has been observed that in many instances medical practitioners wait for larger studies to be conducted for the safety and efficacy of a formulation, or wait for some influencer to start prescribing the medicine, before they themselves start prescribing the product. Thus, top management of pharmaceutical companies must wait patiently for about a year after allocation of the promotional budget, before they can calculate their returns on promotional expenses. The result of this study therefore helps the corporate level decision makers in the firms associated with the pharmaceutical industry, to take decisions confidently relating to the strategic goal setting process of the organization, since it provides clarity with respect to the impact that the promotional budget would have on the sales.
Conclusion
Budgeting for promotional mix is a planned course of action decided by the strategic business unit heads in general. A fair bit of optimization is involved in the process since firms aim to maximize the returns with respect to revenue generated while working with the budget constraint. A conservative spend on the promotional mix may result in reduced revenue generation in the future whereas any unnecessary expenditure has its own demerits.
As far as the pharmaceutical industry is concerned, promotional mix is mainly in the form of personal selling and sales promotion, where prescription drugs are marketed ethically by the salespeople. The selling activity is supported by sponsorships of medical practitioners to conferences, distributing samples, promotional materials including books, journals and other literature that are given to them from time to time by the salespeople through personal selling activities.
The primary objective of the study was to check whether promotional mix and sales revenue have any stable long-term relationship in the pharmaceutical industry in India. Another objective was to ascertain whether there is any positive relationship between the two. The results show that although promotional mix and sales revenue do not have a long-term association, promotion mix positively affects sales revenue in the short-run with a lag period of one year. The results of the study will help decision makers in the pharmaceutical industry in India while taking strategic decisions regarding the amount of promotional expenditure to be made for achieving certain sales objectives. The outcome of the study will also help them have an insight into time duration that such investments on promotional mix may take to fulfil sales objectives.
Future Scope: This study looks at the effect of promotional mix on sales over a ten-year period in the pharmaceutical sector in India. But there are other performance measures for measuring sales revenue, like return on investment, market capitalization, gross profits, on which similar study can be attempted in future. Also, for this industry since sales promotion is the major component of promotional mix, the effect of individual elements of the promotional mix like samples, physician detailing, gift reminder, and so on, on sales may also be tested.J
References
- Adebisi S A and Babatunde B O (2011), "Strategic Influence of Promotional Mix on Organisation Sale Turnover in the Face of Strong Competitors", Business Intelligence Journal, Vol. 4, No. 2, pp. 343-349.
- Alowi M and Kani Y (2018), "Impact of Pharmaceutical Companies' Promotional Tools on Physicians Prescription Patterns: A Systematic Review", Journal of Applied Pharmacy, Vol. 10, No. 3, pp. 1-10.
- Alves T L, Lexchin J and Mintzes B (2019), "Medicines Information and the Regulation of the Promotion of Pharmaceuticals", Science and Engineering Ethics, Vol. 25, No. 4, pp. 1167-1192.
- Chatfield C (1996), The Analysis of Time Series: An Introduction, 5th Edition, Chapman.
- Das A and Samanta A (2013), "Stock Price Behaviour and Dividend Policy: An Empirical Investigation in Information Technology Sector of Corporate India in Liberalized Era", International Journal of Marketing, Financial Services and Management Research, Vol. 2, No. 9, pp. 146-153.
- Dekimpe M G, Hanssens D M and Risso J S (1999), "Long Run Effects of Price Promotion in Scanner Markets", Journal of Econometrics, Vol. 89, Nos. 1-2, pp. 269-291.
- Dickey D A, Jansen D W and Thornton D L (1991), "A Primer on Cointegration with an Application to Money and Income, Review", March/April, pp. 58-78, available at: http://research.stlouisfed.org/publications/review/91/03/Primer_Mar_Apr1991.pdf
- Engle RF and Granger C W J (1987), "Cointegration and Error-Correction: Representation, Estimation, and Testing", Econometrica, Vol. 55, No. 2, pp. 251-276.
- Gujrati D N and Sangeetha S (2007), Time Series Econometrics: Some Basic Concepts, Basic Econometrics, 4th Edition, Tata McGraw Hill, New Delhi.
- Guo Chiquan (2003), "Cointegration Analysis of the Aggregate Advertising-Consumption Relationship", Journal of Academy of Business and Economics, Vol. 1, No. 2, pp. 179-190.
- Hamilton J D (1994), Vector Autoregressions, Time Series Analysis, Princeton University Press, Princeton, New Jersey.
- India Brand Equity Foundation (2020), Indian Pharmaceuticals Industry Report, March. Retrieved on May 11, 2020 from: https://www.ibef.org/industry/pharmaceutical-india.aspx
- Johansen S (1988), "Statistical Analysis of Cointegrating Vectors", Journal of Economic Dynamics and Control, Vol. 12, Nos. 2-3, pp. 231-254.
- Johansen S and Juselius K (1990), "Maximum Likelihood Estimation and Inference on Cointegration with Application to the Demand for Money", Oxford Bulletin of Economics and Statistics, Vol. 52, No. 2, pp. 169-210.
- Kathuria V (2008), "The Impact of FDI Inflows on R&D Investment by Medium-and High-Tech Firms in India in the Post-Reform Period", Transnational Corporations, Vol. 17, No. 2 pp. 45-66.
- Kilian L (2001), "Impulse Response Analysis in Vector Autoregressions with Unknown Lag Order", Journal of Forecasting, Vol. 20, No. 3, pp. 161-179.
- Kremer S T M, Bijmolt T H A, Leefang P S H and Wieringa J E (2008), "Generalizations on the Effectiveness of Pharmaceutical Promotional Expenditures", International Journal of Research in Marketing, Vol. 25, No. 4, pp. 234-246.
- Kwiatkowski D, Philips P C B, Schmidt P and Shin Y (1992), "Testing the Null Hypothesis of Stationarity Against the Alternative of a Unit Root", Journal of Econometrics, Vol. 54, Nos. 1&3, pp. 159-178.
- Liew K S (2000), "The Performance of AICC as Lag Length Determination Criterion in the Selection of ARMA Time Series Models", Unpublished Thesis, Department of Mathematics, Universiti Putra Malaysia, available at: http://citeseerx.ist.psu. edu/viewdoc/download?doi=10.1.1.509.149&rep=rep1&type=pdf
- Little J D C (1979), "Aggregate Advertising Models: The State of the Art", Operations Research, Vol. 27, No. 4, pp. 629-667.
- Ma J, Stafford R S, Cockburn I M and Finkelstein S N (2003), "A Statistical Analysis of the Magnitude and Composition of Drug Promotion", Clinical Therapeutics, Vol. 25, No. 5, pp. 1503-1517.
- MacKinnon J, Haug A and Michelis L (1999), "Numerical Distribution Functions of Likelihood Ratio Tests for Cointegration", Journal of Applied Econometrics, Vol. 14, No. 5, pp. 563-577.
- Mehta D (2019), "India's Pharma Market Grows at Fastest Pace in at least Five Quarters". Retreived on May 10, 2020 from Bloomberg Quint: https://www.bloombergquint.com/business/indias-pharma-market-grows-at-fastest-pace-in-at-least-five-quarters
- Narayanan S, Desiraju R and Chintagunta P K (2004), "Return on Investment Implications for Pharmaceutical Promotional Expenditures: The Role of Marketing Mix Interactions", Journal of Marketing, Vol. 68, October, pp. 90-105.
- Pascal Iloh G U and Chukwuonye M E (2017), "Drug Promotion in a Resource-Constrained Nigerian Environment: A Cross Sectional Study of the Influence of Pharmaceutical Sales Representatives on the Prescribing Behaviours of Medical Practitioners in Abia State", Archives of Medicine and Health Sciences, Vol. 5, No. 2, pp. 215-222.
- Perron P (1989), "The Great Crash, the Oil Price Shock and the Unit Root Hypothesis", Econometrica, Vol. 57, No. 6, pp. 1361-1401.
- Pesaran H H and Shin Y (1997), "Generalized Impulse Response Analysis in Linear Multivariate Models", Economics Letters, Vol. 58, No. 1, pp. 17-29.
- Pokharel P R (2017), "Promotional Tools Effect on Pharmaceuticals Marketing", The Saptagandaki Journal, Vol. 8, February, pp. 79-84.
- Potluri R M (2008), "Assessment of Effectiveness of Marketing Communication Mix Elements in Ethiopian Service Sector", African Journal of Business Management, Vol. 2, No. 3, pp. 59-64.
- Rakshit D (2006), "EVA Based Performance Measurement: A Case Study of Dabur India Limited", Vidyasagar University Journal of Commerce, Vol. 11, pp. 40-59.
- Shah S A, Khan N, Md. Ayub and Anwar A (2017), "Influence of Pharmaceutical Promotional Mix Instruments upon Healthcare Consultants Prescription Decision Making", Journal of Managerial Sciences, Vol. 11, No. 4, pp. 142-156.
- Siddhanta S and Banerjee N (2014), "The Impact of Promotional Mix on Profit in the B2B Sector", Marketing Intelligence and Planning, Vol. 32, No. 5, pp. 600-615.
- Siddhanta S and Banerjee N (2013), "A Study on the Impact of Marketing Communication on Profit in the Indian Pharmaceutical Industry", Conference Proceedings of 5th IIMA Conference on Marketing in Emerging Economies (ISBN:978-81-920800-1-7) held at Indian Institute of Management Ahmedabad from January 9-11, 2013.
- Wieringa J E and Leeflang P S H (2013), "Modelling the Effects of Promotion Expenditures on Sales of Pharmaceuticals", Applied Economics, Vol. 45, No. 24, pp. 3389-3399.