Dec'18
The IUP Journal of Entrepreneurship Development
Archives
Agricultural Demographics and Institutional Credit Disbursement: A Study in Selected Districts of Haryana
Arti Gaur
Assistant Professor,
Department of Business Administration,
CDLU, Sirsa, Haryana, India.
E-mail: artigaur2009@gmail.com
Neelam Kaushal
Assistant Professor,
Department of Business Administration,
NIT, Kurukshetra, Haryana, India;
and is the corresponding author.
E-mail: muktis73@gmail.com
Agriculture is the backbone of the economic system of an agrarian country like India. In addition to providing food and raw materials, it also provides employment opportunities to a large percentage of population. The present study discusses the various demographic factors of agriculture in three selected districts of Haryana—Kaithal, Bhiwani and Fatehabad. The various demographics studied in this paper will be of help to financial institutions to construct a decision base for institutional credit disbursement and generalization of the concept of entrepreneurship among the farming community in other regions.
Introduction
For decades, agriculture has been associated with production of essential food crops. At present, agriculture is above and beyond farming and includes forestry, dairy, fruit cultivation, poultry, bee keeping, mushroom cultivation, etc. Today, processing, marketing and distribution of crops and livestock products are all acknowledged as part of agriculture. Thus, agriculture could be referred to as production, processing, promotion and distribution of agricultural products. Agriculture is the major constituent of the primary sector in India. Indian agriculture is broadly a story of success. It has done remarkably well in terms of output growth, despite weather and price shocks in the past few years. India is the first in the world in the production of milk, pulses, jute and jute-like fibers and second in production of rice, wheat, sugarcane, groundnut, vegetables, fruits and cotton. It is one of the leading producers of spices and plantation crops as well as livestock, fisheries and poultry in the world.
India is mainly an agricultural country. Approximately 72.2% of India's population lives in villages and about 65-70% population depends directly or indirectly on agriculture and allied activities. Agriculture, contributing 16% to the Gross Domestic Product (GDP) of India and sustaining the livelihood of about 65% of the country's population, is the largest and most important sector of India. The Eleventh Five-Year Plan (2007-12) witnessed an average annual growth of 3.6% in the GDP from agriculture and allied sector against a target of 4.0%. While it may appear that the performance of the agriculture and allied sector has fallen short of the target, production has improved remarkably, growing twice as fast as the population.
Primary Agricultural Credit Societies (PACS) occupy a major position in the agricultural cooperative credit structure and shape its base. PACS are planned at the grassroots level of a village or a cluster of small villages. It is this fundamental unit which deals in a straight line with the rural (agricultural) borrowers, provides those advances and accumulates repayments of loans agreed. It acts as the link between the eventual borrowers on the one hand, and the superior financing agencies, specifically the SCBS, and the RBI/NABARD on the other hand. As such, the strength and power of the cooperative credit association depends significantly on the health and strength of these societies. But, regardless of much official attempt and support and numerical development of the PACS in membership, working capital, loans agreed and other actions, their health and functioning leave much to be done.
India's agricultural exports are booming at a time when many other leading producers are experiencing difficulties. The better agricultural performance is the result of: (a) farmers' response to better prices; (b) continued technology gains; and (c) appropriate and timely policies coming together. Yet, India is at a juncture where further reforms are urgently required to achieve greater efficiency and productivity in agriculture for sustaining growth. The fruitfulness of the final outcome of every research can be fully appreciated only when the results are studied with regard to the geographical and demographic features such as location, size of area, cropping pattern, income, employment level, workforce, etc. Hence, an attempt has been made in the present paper to analyze the characteristics of farming in selected districts of Haryana, India. This is done with the aim to help financial institutions in framing better credit disbursement policies for farmers, aiding them in increasing production.
Literature Review
Calderon and Serven (2004) estimated the levels of public investment in infrastructure in nine Latin American countries and show that, in 1997, the levels range from around 4.5% of GDP in Colombia to about 0.2% in Argentina. In most developing countries, however, public investment expenditures, particularly in infrastructure, have been reduced disproportionately due to fiscal retrenchment during the 1990s. For example, during 1992-98, public investment in infrastructure decreased from about 1.0 to 0.2% and about 4.0 to 2.0% in Argentina and Bolivia respectively. Among sectors, the decline was sharpest in the power sector in Argentina, and in transport sector in Bolivia. The study illustrated that the poverty effects of infrastructure may also contribute to reducing rural/urban income inequality. It showed that income inequality had declined with higher quantity and quality of infrastructure in rural areas of developing countries between 1960 and 2000. However, the impact of investments in infrastructure on the poor may be very limited if services are not affordable for the poor. Appropriate pricing of services has been a very controversial aspect of the reform towards privatization of the provision of services, such as water, traditionally provided by the public sector.
Atteri et al. (2005) in their study revealed that the principal source of income of more than 50% farmers in most of the regions in the country is the cultivation of field crops. But more than 45% of the farmers pursuing cultivation activity are indebted. Only a relatively lesser number of farmers avail loan for the purpose of animal husbandry-related activities and plantation. More than 80% of the farmers having land less than 2 ha are indebted. The average amount of loan per farm in India is 12,585, while it is the highest at 17,000 and 25,000 in southern and western regions respectively. The average amount of loan taken by farmers increased by 7,100 with the increase in farm size by 1 ha. Today farmers take more loans from banks, however, money lenders and traders still remain the important sources of borrowing.
Andersen and Shimokawa (2006) suggested that in addition to investment in physical infrastructure such as roads, electricity generation, irrigation facilities and telecommunications, the campaign must include efforts to design and implement new rural institutions, improve domestic rural markets for inputs, outputs and capital, generate appropriate technology for small-scale farmers, facilitate non-agricultural enterprises in rural areas, and remove trade distorting agricultural policies by OECD countries.
Mani (2007) concluded that Indian agriculture has to be competitive in the backdrop of globalization and consequent reforms. The overall growth rate of about 9% proposed in the Eleventh Five-Year Plan can be achieved only if agriculture growth is maintained around 4%, while the current rate is only 2.7%. Further, the government emphasized on added priority for agriculture in the coming years. In this context, it is high time to revamp the institutional credit for agriculture, particularly the investment credit to meet the global and domestic challenges.
Karmakar (2008) in his study discussed the trends and issues relating to rural finance during the post-reform period. He suggested that the rural Microfinance Institutions (MFIs), which have emerged as a powerful tool for fighting poverty, be made a part of the financial system for effective delivery of rural financial services. The banks need to gear up their rural branches for facilitating bank linkages of SHGs where the program has not shown satisfactory progress.
Hans (2009) through his paper made an attempt to trace the growth and problems of agriculture during the reforms period and to find ways and means of resolving the present crisis in order to develop Indian agriculture into a vibrant sector contributing substantially to the growth of New Age Indian Economy and for its sustainable development.
Kumar (2010) in his study concluded that among the problems faced by the farmers in marketing their produce, the major ones were traders' collusion, late payment and incorrect weighing, lack of packing material, high transportation cost, lack of credit and storage facilities in market yards, and lack of market information on prices. The major conclusion of the paper is that there is a tremendous scope for improvement in the functioning of Agricultural Produce Market Committees (APMCs) and there should be a parallel setup for new markets in the private sector and for farmers' markets, for which provision has now been made under the Model Markets Act 2004.
Data and Methodology
Study AreaIn this paper, the Haryana state has been studied. In India, Haryana ranks 20th in terms of area (44,212 km2). Area under forest is 1,684 km2 and net sown area is 3,550 km2. As per Census 2011, Haryana state is at 16th position in terms of population, with state population being equal to 25,353,081 (8,821,588 in urban areas and 16,531,493 in rural areas). Haryana holds 11th position in terms of population density with a density of 573/km2. Haryana is the second largest contributor of food grains to the central pool, with more than 60% exports of basmati rice taking place from Haryana alone.
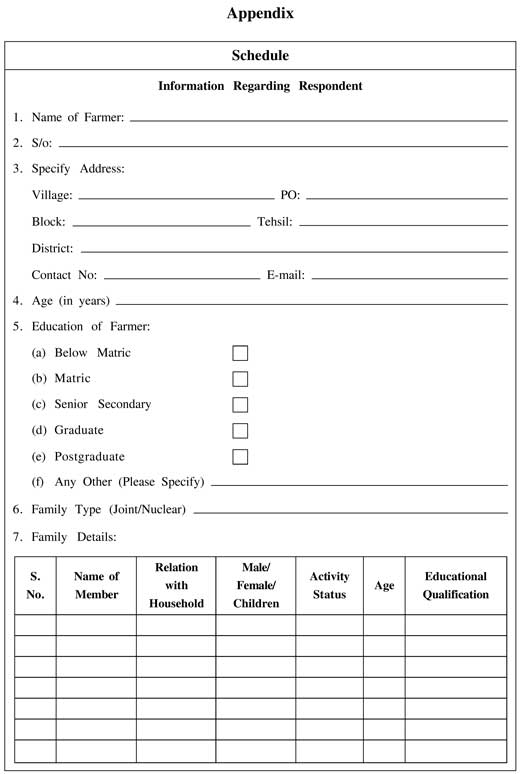
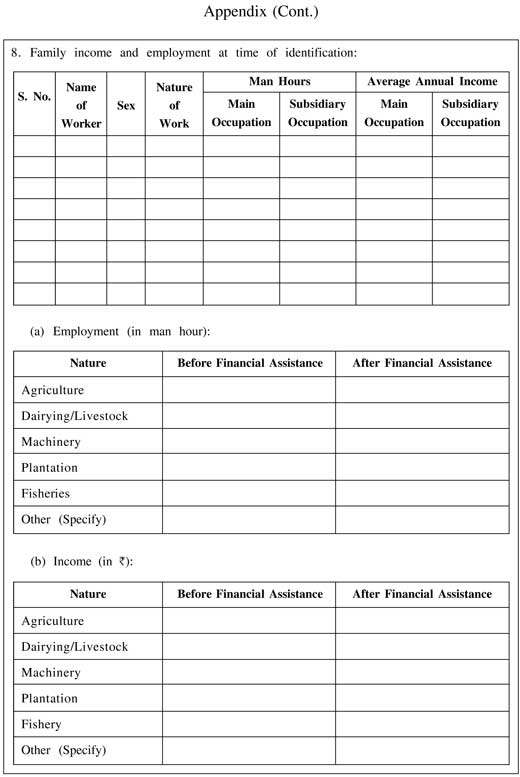
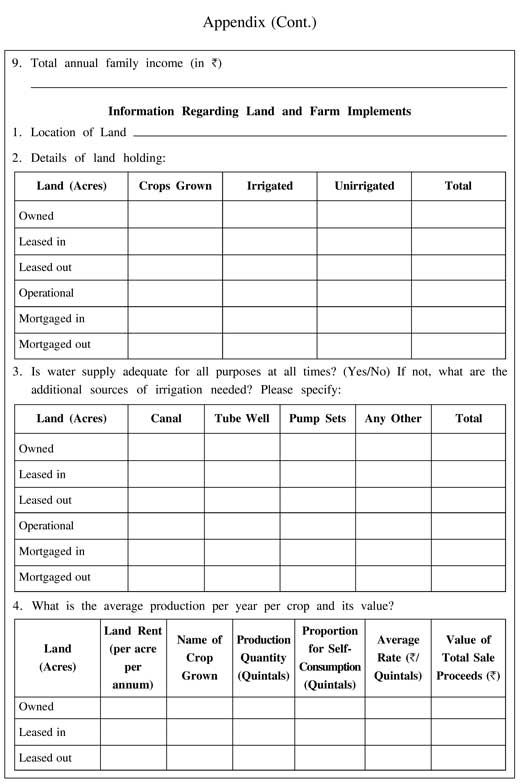
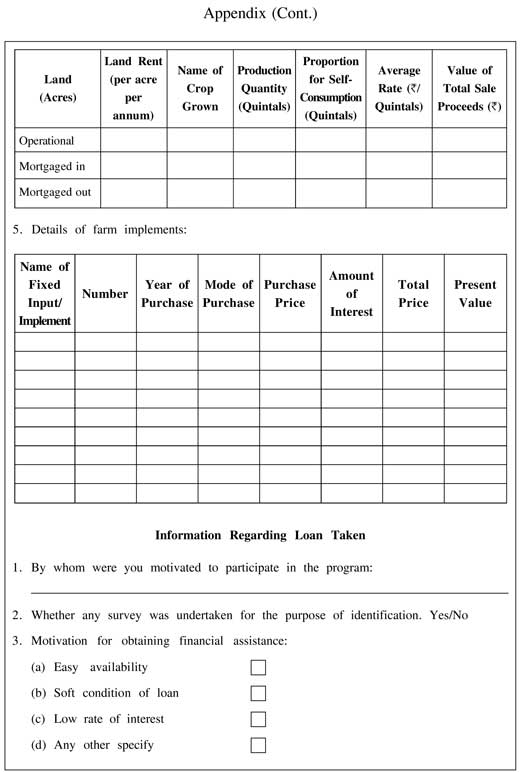
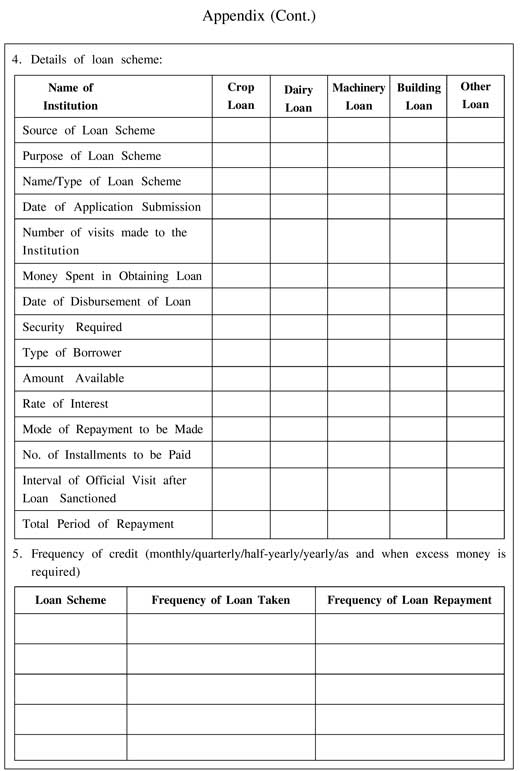
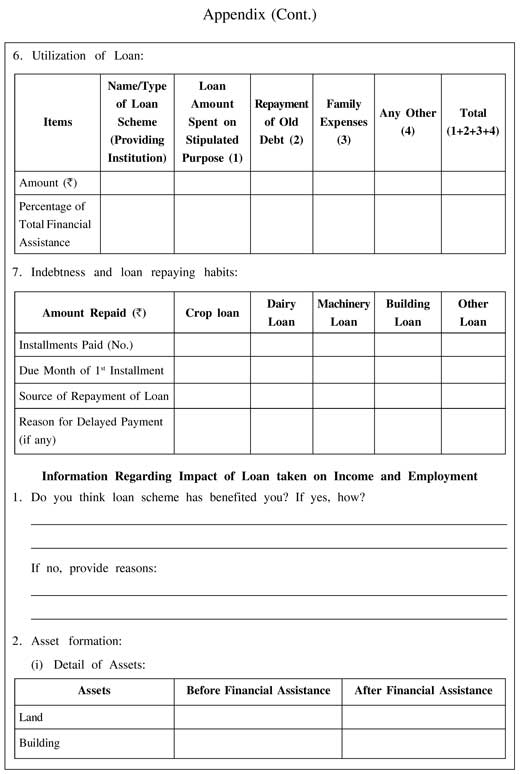
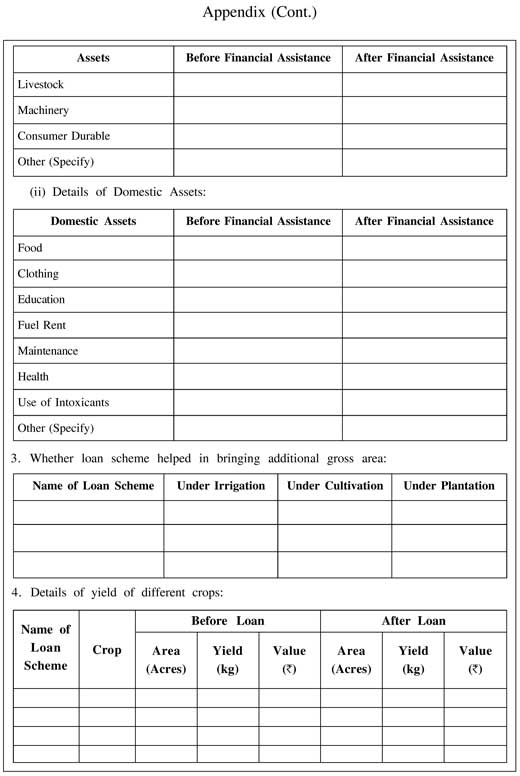
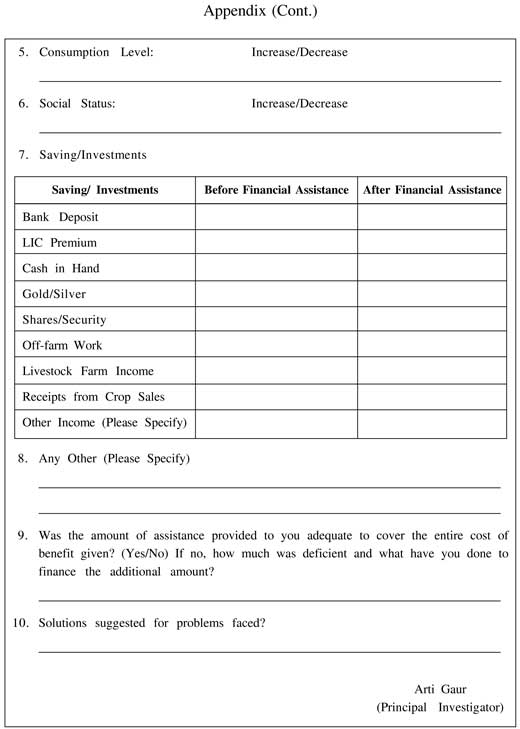
Data CollectionThe study is descriptive in nature. It is based on available information collected through primary as well as secondary sources. In the present study primary data pertaining to credit disbursement, utilization, repayment, income and employment generated etc. have been collected by conducting personal interviews with the respondent. A schedule cum questionnaire (see Appendix) was designed to collect data. On the other hand, the required secondary data pertaining to institutional credit given to the farmers has been collected from RBI Bulletins, Annual Reports of RBI, websites of RBI, lead bank offices (Punjab National Bank) and other published and unpublished secondary sources.
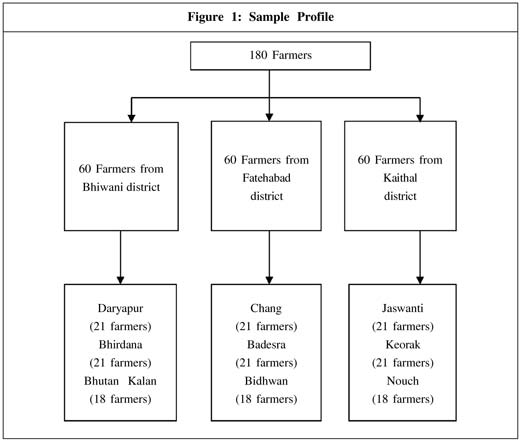
Sample Profile60 farmers from each cluster of villages (21 small farmers, 21 medium farmers and 18 large farmers) were selected for identification of the factors affecting the disbursement of credit to the farmers (Figure 1). In this way, aggregately 180 farmers from three blocks and nine villages were finalized for collection of required primary data.
Distribution of Land HoldingIn an economy, land is considered to be the basic asset and essential for cultivation of crops. Land is associated with control over and right to use to other resources. In short, land is a foremost source of income and an index of status of the family occupied in agriculture. In this analysis, farmers are divided into three types, i.e., small, medium and large. Small farmers are those who hold less than 2.5 acres of land. Medium farmers' holding ranges from 2.5 to 5.0 acres, while large farmers' holding is more than 5.0 acres.
Results and Discussion
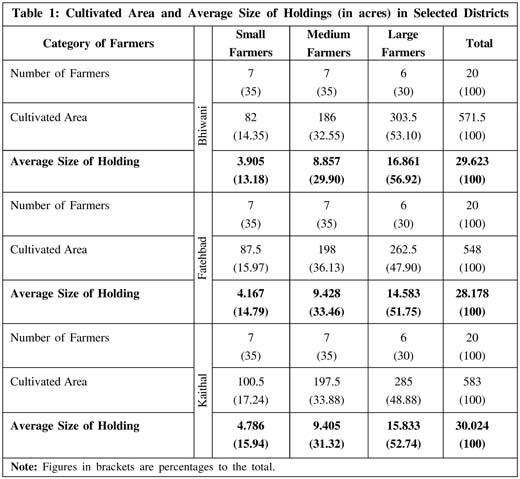
Table 1 gives district-wise description of the cultivated area and average size of holding. In Bhiwani district, average size of holding in case of small farmers is 3.905 acres which is 13.18%; in case of medium farmers it is 8.857 acres which is 29.90%; and in case of large farmers it is 16.861 acres which is 56.92% of the total average size of 29.623 acres. In Fatehabad district, average size of holding in case of small farmers is 4.167 acres which is 14.79%; in case of medium farmers is 9.428 acres which is 33.46%; and in case of large farmers is 14.583 acres which is 51.75% of the total average size of 28.178 acres. In Kaithal district, average size of holding in case of small farmers is 4.786 acres which is 15.94%; in case of medium farmers is 9.405 acres which is 31.32%; and in case of large farmers is 15.833 acres which is 52.74% of the total average size of 30.024 acres. It can be concluded that all three districts have almost same size of holding on average and cultivated area.
Table 2 describes the cropping pattern of farmers of all three districts according to their size of holding. The main crops in the selected districts are wheat, guar, cotton, rice and mustard. It is observed from Table 2 that the major crop is wheat which is produced by all the farmers in the three selected districts, while others are secondary crops for the farmers. The total number of farmers producing rice in Bhiwani district is 13 of which 8 (61.54%) are
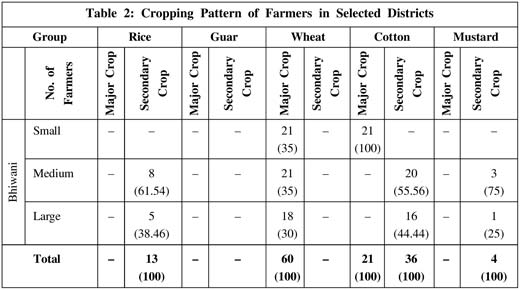
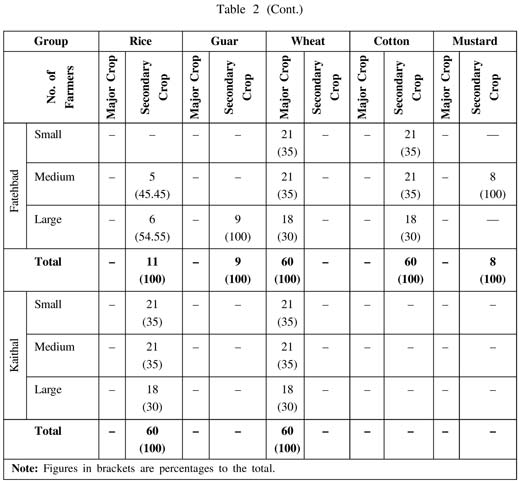
medium farmers and 5 (38.45%) are large farmers. The total number of farmers producing rice in Fatehabad district is 11, of which 5 (45.45%) are medium farmers and 6 (54.55%) are large farmers. The total number of farmers producing rice in Kaithal district is 60, of which 21 (35%) each are small farmers and medium farmers, while 18 (30%) are large farmers. Further, only 9 farmers produce guar in Fatehabad district. In Bhiwani district, 36 farmers produce cotton as the main secondary crop, while 60 farmers in Fatehabad district produce cotton. Therefore, it can be concluded that a majority of the farmers are interested in producing wheat and also use the credit taken by them for increasing wheat production.
Table 3 shows the sources of irrigation of all the three districts. It presents the percentage of irrigated area in total cultivated area of small, medium and large farmers in Bhiwani, Fatehabad and Kaithal district according to the different sources of irrigation. It is observed that among the various sources of irrigation, canal is the major source for small farmers. The total land holding of small farmers of Bhiwani district is 77 acres, of which canal irrigated land is 43.5 acre (56.49%) and tube well irrigated land is 33.5 acre (43.15%). The total land holding of small farmers in Fatehabad district is 87.5 acre, of which canal irrigated land is
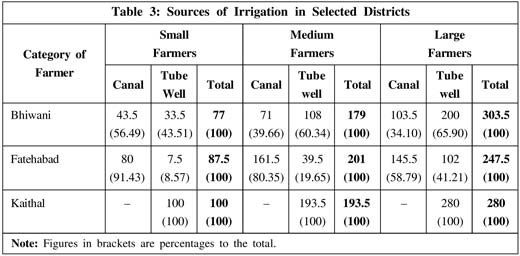
80 acre (91.43%) and tube well irrigated land is 7.5 acre (8.57%). The total land holding of small farmers in Kaithal district is 100 acre, which is totally irrigated by the tube wells.
In case of medium farmers, the total land holding in Bhiwani district is 179 acre, of which 71 acre (39.66%) land is canal irrigated and 108 acre (60.34%) land is tube well irrigated. The total land holding of medium farmers in Fatehabad district is 201 acre, of which 161.5 acre (80.35%) land is irrigated by canal and 39.5 acre (19.65%) land is irrigated by tube well. The total land holding of medium farmers in Kaithal district is 193.5 acre which is totally irrigated by the tube well.
In case of large farmers, the total land of holding in Bhiwani district is 303.5 acre of which 103.5 acre (34.10%) land is irrigated by canal and 200 acre (65.90%) land is irrigated by tube well. The total land holding of large farmers in Fatehabad district is 247.5 acre of which 145.5 acre (58.79%) land is irrigated by canal and 102 acre (41.21%) land is irrigated by tube well. The total land holding of large farmers in Kaithal district is 280 acre which is totally irrigated by the tube well. Thus, it can be concluded that in Kaithal district tube well is the main source of irrigation for small, medium and large farmers. Successful use of tube well in this region is a good sign for farmers as it means that the water level is highly sufficient in Kaithal district and the farmers prefer crop rice because of sufficient supply of water. In Fatehabad district, canal is the primary source of irrigation; because of availability of canal water, while tube well is the secondary source of irrigation, and in Bhiwani district, tube well is the primary source of irrigation, and canal is the secondary source of irrigation because of non-availability of canal water facility in this region.
Table 4 shows the literacy level of farmers of all the three districts. It is observed that the total number of farmers in Bhiwani district is 60, of which the literacy level of 5 farmers is less than 5th class, 21 farmers between 5th to 10th class, 22 farmers between 10th to 12th class and 12 farmers more than 12th class. Total number of farmers in Fatehabad district is also 60, of which the literacy level of 22 farmers is less than 5th class, 21 farmers between 5th to 10th class, 8 farmers between 10th to 12th class and 9 farmers more than 12th class. The total number
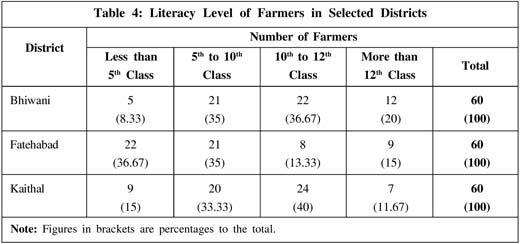
of farmers in Kaithal district is again 60, of which the literacy level of 9 farmers is less than 5th class, 20 farmers between 5th to 10th class, 24 farmers between 10th to 12th class and 7 farmers more than 12th class. Therefore, it can be concluded that the farmers of Bhiwani district are more educated than those of Fatehabad and Kaithal districts. It means the youth of Bhiwani district are forced to adopt agriculture as profession because of non-availability of sufficient employment opportunities. Most of the farmers of Fatehabad district are less educated, while a majority of the farmers of Kaithal district are senior secondary qualified.
Income from agriculture for the present study comprises income from crops such as wheat, rice, guar and cotton, income from livestock (milch animals) and off-farm services. Crop income was the value of both the main crops and their byproducts at the then prevailing market prices. Income of the farmer groups from agriculture is presented in Table 5, and an overview of crop production by farmers in selected districts is presented in Table 6.
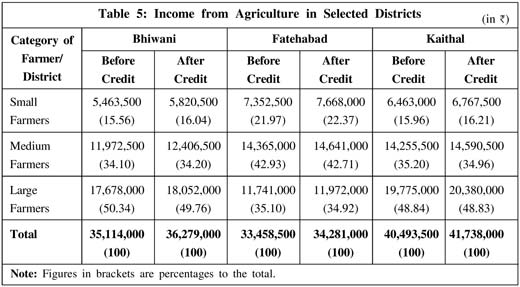
It is observed from Table 5 that the total agricultural income in Bhiwani district before credit is 35,114,000 and after credit is 36,279,000. Out of the before credit income of 5,463,500 (15.56%) belongs to small farmers, 11,972,500 to medium farmers (34.10%) and 17,678,000 to large farmers (50.34%). Out of the after credit income 5,820,500 belongs to small farmers (16.04%), 12,406,500 to medium farmers (34.20%) and 18,052,000 to large farmers (49.76%). The total agricultural income in Fatehabad district before credit is 33,458,500 and after credit is 34,281,000. Out of the before credit income, 7,352,500 belongs to small farmers (21.97%), 14,365,000 to medium farmers (42.93%) and 11,741,000 (35.10%) to large farmers. Out of the after credit income, 7,668,000 belongs to small farmers (22.37%), 14,641,000 to medium farmers (42.71%) and 11,972,000 to large farmers (34.92%).
The total agricultural income in Kaithal district before credit is 40,493,500 and after credit is 41,738,000. Out of the before credit income, 6,463,000 belongs to small farmers (15.96%), 14,255,500 to medium farmers (35.20%) and 19,775,000 to large farmers (48.84%). Out of the after credit income, 6,767,500 belongs to small farmers (16.21%), 14,590,500 to medium farmers (34.96%) and 20,380,000 to large farmers (48.8%). Thus, it can be concluded that the income from agriculture is more in case of small and medium farmers in Fatehabad district, while it is more in case of large farmers in Kaithal district
On the whole, income from agriculture is highest in Kaithal district, the reason being that the cultivated area in Kaithal region is more, and therefore, farmers are self-sufficient and generate more income.
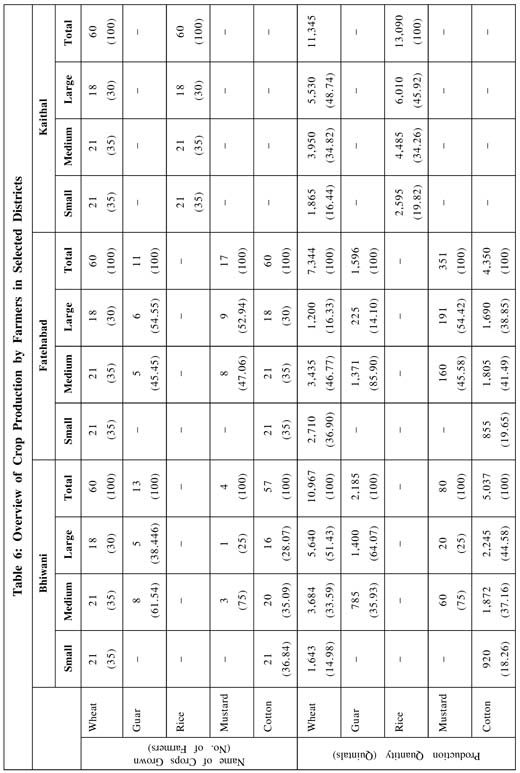
Table 6 presents the type of crops grown by the farmers, production quantity, proportion for self-consumption, average rate and value of total sale proceeds from crops for large, medium and small farmers in Bhiwani, Fatehabad and Kaithal districts. It is observed from the table that same number of farmers (i.e., 60) grow wheat in all districts. Guar is grown by 13 farmers in Bhiwani and 11 farmers in Fatehabad district. Kaithal district produces only rice. In the case of production quantity, Kaithal district produces the maximum quantity of wheat as compared to other selected district, followed by Bhiwani in the second and Fatehabad is the third position. Bhiwani produces 2,185 quintals of guar, while Fatehabad produces 1,596 quintals of guar.
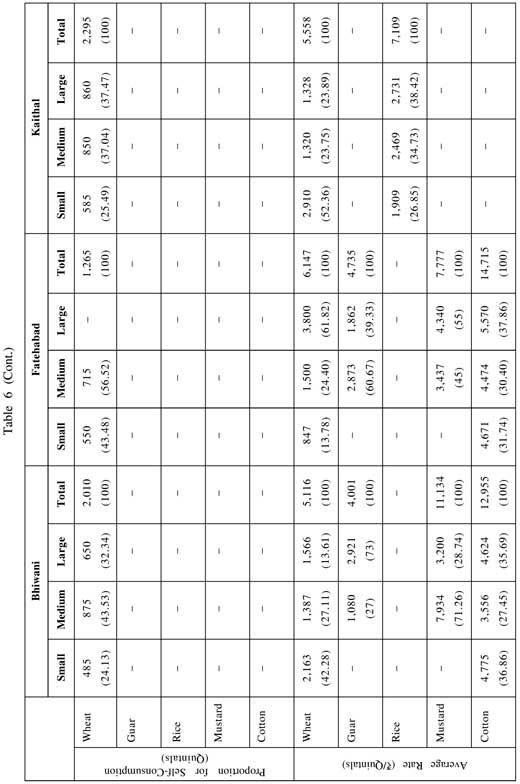
It is further observed from Table 6 that farmers retain a certain proportion of wheat for self-consumption. It is 2,010 quintals in Bhiwani, 1,265 quintals in Fatehabad and 2,295 quintals in Kaithal district. After consumption, the remaining proportion is sold and the average rate of wheat is 5,116 in Bhiwani district, 6,147 in Fatehabad district and 5,558 in Kaithal district. The average rate of income from guar was 4,001 in Bhiwani and 4,735 in Fatehabad district. The average rate of income for rice is 7,109 in Kaithal district.
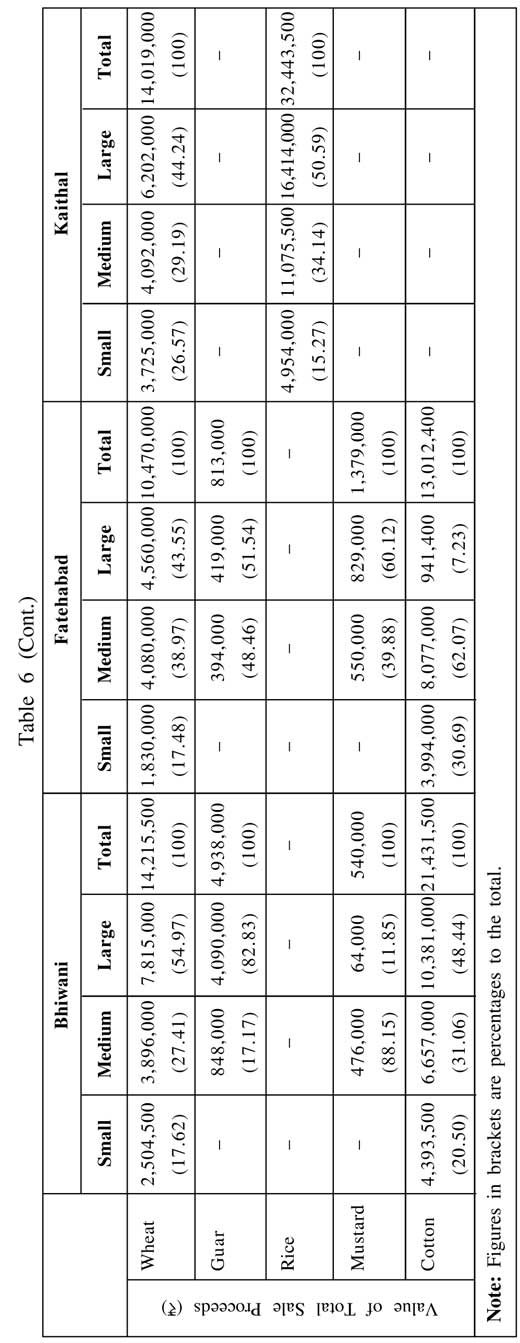
Table 6 also reveals the value of total sales and it is concluded that total amount of sales for wheat is 14,215,500 in Bhiwani, 10,470,000 in Fatehabad and 14,019,000 in Kaithal district. The value of total sales for guar is 4,938,000 in Bhiwani and 813,000 in Fatehabad district. The value of total sales for rice is 32,443,500 in Kaithal district, while for Mustard it is 540,000 in Bhiwani and 1,379,000 in Fatehabad district. The value of total sales of cotton is 21,431,500 in Bhiwani and 13,012,400 in Fatehabad district.
Table 7 shows the gross income of farmers from secondary occupations like fisheries, livestock, off-farm services, etc. It is observed from the table that farmers in Kaithal are earners of high income from secondary occupations, followed farmers in Bhiwani and
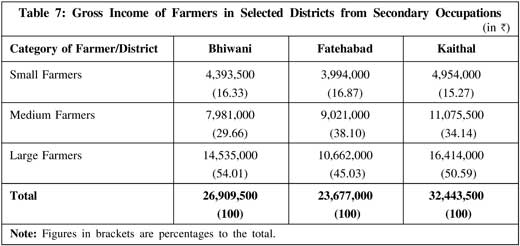
Fatehabad. The total income of Bhiwani is 26,909,500, of which 4,393,500 belongs to small farmers, 7,981,000 to medium farmers and 14,535,000 to large farmers. The total income of farmers in Fatehabad is 23,677,000, of which 3,994,000 belongs to small farmers, 9,021,000 to medium farmers and 10,662,000 to large farmers. The total income of farmers in Kaithal is 32,443,500, of which 4,954,000 belongs to small farmers, 11,075,500 to medium farmers and 16,414,000 to large farmers. It is concluded that the farmers of Kaithal district earn highest income from secondary occupations, followed by those from Bhiwani district. On the other hand, farmers from Fatehabad district are least earners.
Conclusion
The present study familiarizes us with a variety of demographics of agriculture in the selected districts of the Haryana—Kaithal, Bhiwani and Fatehabad. The various demographics studied will help the financial institutions to construct a decision base for institutional credit disbursement and generalization of the concept in other areas. The main findings are:
- It is concluded that Kaithal district has the highest land holding in comparison to the other two districts. The small farmers in Bhiwani and Fatehabad districts have almost same size of land holding, while land holding of small farmers is highest in Kaithal district. Further, large farmers in Bhiwani district show highest land holding among the three districts. The cultivated land area is almost the same in case of medium farmers in all three districts.
- It is found that a majority of the farmers are interested in producing wheat as the major crop and also use the credit taken in increasing the production of wheat.
- It is observed that rice is the main secondary crop in all the selected districts of Haryana because of soil fertility and agro-climatic conditions.
- It is observed that in Kaithal district, tube well is the main source of irrigation for small, medium and large farmers. Successful use of tube well in this region is a good sign for farmers as it means that the water level is highly sufficient in Kaithal district and the farmers prefer to crop rice because of sufficient supply of water. In Fatehabad district, canal is the primary source of irrigation because of availability of canal water, while tube well is the secondary source of irrigation, and in Bhiwani district, tube well is the primary source of irrigation and canal is the secondary source of irrigation because of non-availability of canal water facility in this region.
- It can be concluded that the farmers of Bhiwani district are more educated than Fatehabad and Kaithal districts. It means the youth of Bhiwani district are forced to adopt agriculture as profession because of non-availability of sufficient employment opportunity. Most of the farmers of Fatehabad district are less educated, while a majority of the farmers of Kaithal district are senior secondary qualified.
- It is observed that the income from agriculture is more in case of small and medium farmers in Fatehabad district, while it is more in case of large farmers in Kaithal district. On the whole, income from agriculture is highest in Kaithal district, the reason being that the cultivated area in Kaithal region is more, and therefore, farmers are self-sufficient and generate more income.
- It is further observed that wheat and rice are main crops of Kaithal district due to sufficient supply of water (water level is high), while wheat, cotton, guar and mustard are the main crops of Bhiwani and Fatehabad district. Bhiwani district has the maximum sales proceeds/income from wheat, followed by Kaithal and Fatehabad in second and third position respectively. In terms of sale proceeds of rice, Kaithal is the only district producing rice and thus has high sale proceeds because of its agro climate conditions. Maximum sale proceeds/income from cotton is generated by Bhiwani district, followed by Fatehabad district, while Kaithal district does not produce cotton.
- It is further observed that the farmers of Kaithal district earn highest income from secondary occupations, followed by farmers of Bhiwani district. On the contrary farmers of Fatehabad district are least earners from secondary occupations.
The present study can be extended further by performing a comparative analysis of various states for generalization of the concept of entrepreneurship among the farming community in other areas.
Bibliography
- Adhikari C S (1985), "Credit Disbursement and Percolation of Benefit to Weaker Section Under IRDP", Giri Institute of Development Studies, Lucknow.
- Andersen Pinstrup Per and Shimokawa Satoru (2006), "Rural Infrastructure and Agricultural Development", Paper Prepared for Presentation at the Annual Bank Conference on Development Economics, May 29-30, Tokyo, Japan.
- Atteri B R, Kaur Amit and Singh Alka (2005), "Indebtedness in Farm Business in India", Indian Journal of Agricultural Economics, Vol. 60, No. 3, p. 385.
- Calderon C and Serven L (2004), "The Effects of Infrastructure Development on Growth and Income Distribution", World Bank Policy Research, Working Paper 3400.
- Hans V B (2009), "Indian Agriculture in the Globalization Era – Position and Prospects", UGC Sponsored State Level Seminar on 'Impact of the Globalized Economy of India on Agriculture', Department of Economics, Milagres College, Kallianpur, Karnataka.
- http://agriharyana.nic.in/HSCARDB_RepaySchedule.htm
- http://agriharyana.nic.in/Support.htm
- http://www.igidr.ac.in/money/mfc-12/Credit%20delivery__nand%20kishor dhampal%20malik.pdf
- Karmakar K G (2008), "Trends in Rural Finance", Indian Journal Agriculture Economics, Vol. 63, No. 1, pp. 5-18.
- Kumar Parmod (2010), "Market Structure, Conduct and Performance: Empirical Findings from Six States in India", Indian Journal of Agricultural Marketing, Vol. 24, No. 3, pp. 95-130.
- Mani K P (2007), "Institutional Credit for Agriculture: Reflections Since Reforms", Financing Agriculture, Vol. 39, No. 3 (May-June), pp. 33-37.
- Pandey R N, Gangwar A C, Aggarwal Kusum et al. (1984), "Repayment Performance of Borrowers with Respect to Agricultural Loans in Kurukshetra District, Haryana", Research Bulletin No. 11, Haryana Agricultural University, Hisar.
- Parsad Jagdish and Kumar Sunil (1982), "Regional Rural Banks – An Evaluation of Performance", Southern Economist, Vol. 21, No. 6, pp. 20-28.
- Rajkishore P (1988), "Credit Finance of Primary Agricultural Co-Operative Societies Among Farm Household in Orissa", Indian Journal of Agriculture Economics, Vol. XLIII, No. 3 (July-September).
- Singh M L and Mishra M M (1974), "Farm Capital Investment in Purnea District of Bihar", Eastern Economics, Vol. 63, No. 12, p. 509.