Dec'19
The IUP Journal of Entrepreneurship Development
Archives
The Impact of Training on Small and Growing Businesses
Suncan Pavlovic
Visiting Professor, Strathmore Institute for Mathematical Sciences, Strathmore University, Ole Sangale
Road, Madaraka, Nairobi, Kenya. E-mail: spavlovic@strathmore.edu
Jermaine Coelho
Project Manager, Institute for Small Business Initiatives, Strathmore University, Ole Sangale Road, Madaraka,
Nairobi, Kenya; and is the corresponding author. E-mail: jermaine.coelho@strathmore.edu
John Olukuru
Head of Data Science and Analytics, Strathmore University, Ole Sangale Road, Madaraka, Nairobi, Kenya.
E-mail: jolukuru@strathmore.edu
It is widely believed that Small and Growing Businesses (SGBs) have the potential to be global engines of shared prosperity: to drive growth, promote sustainability, and support equality around the world. This study looks at the effect of providing training to SGBs on their growth, profitability and employment creation. Data was collected from participants of the advanced entrepreneurship program at the Institute for Small Business Initiatives in Kenya. The study features the introduction of a new metric?Effective Cash at Owner?s Disposal (ECOD)?which is critical in evaluating SGBs, especially in developing economies. The data was then compared as at the intake date, 1 year and 2 years after. The findings of the study show that the program has a significant positive effect on the businesses that went through it with average revenue increasing by 63%, average EBITDA increasing by 106% and 2.2 net new jobs created by each enterprise within a year of enrolment. The study also finds that the program year is characterized by strong revenue and profit margin growth, as well as relatively moderate employment growth due to the optimization effect. In the year after the program year, the positive trend continues (at a notably lower rate), but once the streamlining process is completed, the employment growth booms (doubling the growth rate from the first year). The study also reveals that remarkable improvement in understanding of finance is not matched by an equivalent improvement in cost optimization and record keeping. The introduction of a userfriendly IT tool for financial analysis and cost optimization is likely to greatly increase the effectiveness of such entrepreneurship programs and create longer lasting impact.
Introduction
The Micro, Small and Medium Enterprises (MSME) sector has garnered increasing attention
from across the globe due to its contribution to the economy and society as a whole, often
being cited as the ?backbone of the economy? (Robu, 2013). This holds true in various parts
of the world from regions such as across Europe, where they represent 99% of all businesses; they have created over 85% of jobs (Commission, 2019) in Southeast Asia, where they again
represent over 90% of enterprises, and generate a majority of the employment (Pratama, 2019) in
China, Japan and the USA (Robu, 2013). It is the same case in Kenya, with over 80% contribution
to employment creation and contributing one-third to the economy?s GDP (KNBS, 2016). Given
the critical role they evidently play in the economy, the high rate of business failure is alarming
with over 60% of businesses closing within the first two years (KNBS, 2016). A study carried out
by Njoroge and Gathungu (2013) on Small and Medium Enterprises (SMEs) in a Kenyan district
revealed the urgent need for training on financial and strategic management for SMEs to grow
beyond the first stage of enterprise development and survive beyond five years.
Small and Growing Businesses (SGBs) differ from the more traditional characterization of
SMEs in two fundamental ways. Firstly, SGBs differ from livelihood-sustaining small
businesses, which start small and are destined to stay that way. Secondly, unlike many
medium-sized companies, SGBs often lack access to the financial and knowledge resources
required for growth (ANDE, 2019). SGBs have the potential to be global engines of shared
prosperity: to drive growth, promote sustainability, and support equality around the world
(ANDE, 2016). The Institute for Small Business Initiatives (ISBI) was founded by an Austrian
NGO ICEP and Strathmore Educational Trust (SET) with the goal to promote business and
financial skills amongst these SGBs in Kenya.
ISBI offers comprehensive innovative business programs for entrepreneurs who wish to
streamline their business operations, expand their business and graduate from micro stage to formal
or higher levels of scale enterprises. The focus of the programs is on the immediate practical value
for entrepreneurs and best practices from each industry involved. All business cases were
developed based on real-life Kenyan examples. Furthermore, the class framework also provides an
excellent opportunity to network and exchange ideas with the like-minded entrepreneurs.
The Advanced Entrepreneurship Program (AEP) is ISBI?s flagship program; it is composed
of 13 half-day sessions held once a week over 3 months. Contrary to most training programs
where participants are either fully sponsored or pay only a small symbolic fee, AEP
participants pay on average US$1,000 which cater for all the direct costs associated with
running the program. This ensures sustainability of the program independent of future
donations, since clients are willing to pay the full cost of the program. This serves as a doubleedged
sword as it forms part of the selection criteria in filtering the entrepreneurs who are
serious and dedicated to improving their businesses while, on the other hand, it ensures that
the program is constantly improving in attempt to deliver value for money to the clients.
Comparing the performance of these entrepreneurs who pay for training to those who take part
in sponsored programs will reveal critical insights which can be used by other training
institutions and NGOs as well as contribute to policy making regarding SGB training.
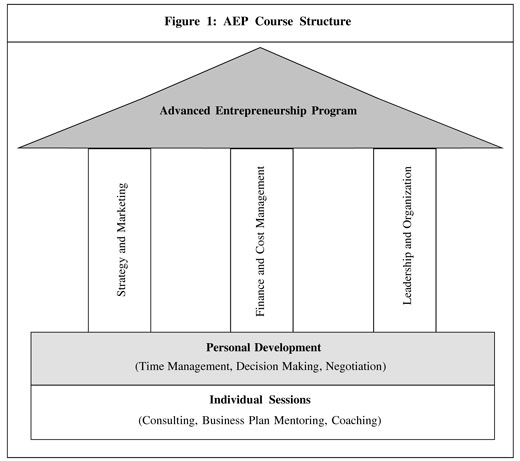
AEP focuses on five main areas: strategy and marketing, finance and cost management,
leadership and organization, tax and law, and personal development. As a value add-on,
participants enjoy the benefit of a choice (depending on their individual priorities) of one of
the following individual services: consulting, coaching or business plan mentoring, typically
between 1-3 months after completion of the class sessions. As shown in Figure 1, these modules form the foundation of the business and when this
foundation is strong, it transforms into the pillars of growth of the business. After the
entrepreneurs gain personal skills that help them develop personally, they gain business skills,
what together results in effective and transformative change within the businesses.
- Annual turnover of US$100,000 (KES10 mn) or more
- Credit capacity of US$50,000 (KES5 mn) or more
- Two years at the least in the same business
- Five full-time employees or more
- Undergraduate degree or higher of the participant entrepreneur
By using this selection process, ISBI is able to select businesses that meet ANDE?s
definition of SGBs of having between 5-250 employees and significant potential, and
ambition for growth (ANDE, 2019). The existing research shows that there is a gap in the efficiency of providing support when
it comes to selecting which firms to support (Woodruff, 2018). Differences in firm performance
after going through training based on ISBI?s selection criteria will provide valuable insights
into developing an optimal selection process for other similar programs.
This paper, in form of a benchmarking report aims to estimate the impact, both financially
and qualitatively, of the program by comparing performance data for the year before the
participant joined the program, one year after and, where applicable, two years after intake
in the program.
Literature Review
Studies reveal that education and training rank highly among the critical factors leading to
the success of entrepreneurs and their businesses (Mehralizadeh and Sajady, 2006). It is also
widely regarded amongst practitioners, researchers and policy makers that entrepreneurship
education results in measurable outcomes (Kozlinska, 2012). There is the increased need and
desire amongst both business schools and firms in measuring the impact of executive and
entrepreneurial education, though it is often difficult to accurately measure due to lack of
baseline data as well as inaccurate or misleading data (Murray, 2019). The diverse content
of various programs combined with differences in duration and intensity makes it difficult to
determine the extent to which such programs can be compared (Ismail, 2018). Generally, the
impact of entrepreneurial education can be measured across two spheres: educational and
socioeconomic (Kozlinska, 2012) where educational learning outcomes are put forward as
knowledge, attitude and skills (Heinonen and Poikkijoki, 2006; and Batarelo et al., 2013).
Other sources refer to the ?impact? of entrepreneurial education moving from the purely
educational dimension to the socioeconomic level which includes increased income, growth
and job creation (Blenker et al., 2006).
Studies throughout the literature reveal conflicting results with some scholars discovering
that there is little to no significant effect on businesses in terms of revenue, profits and
employment amongst Peruvian female entrepreneurs who received training (Karlan and
Valdivia, 2011). Most studies find that business owners implement some of the practices
taught during training, though the magnitude of improvement to practices is often modest at
best (McKenzie and Woodruff, 2013). Despite one of the main aims of entrepreneurship
training programs being the promotion of self-employment through business creation,
evidence from programs in Sri Lanka and Chile find that in the long term (2 years), selfemployment
declined significantly (Mel et al., 2014; and Mart?nez et al., 2016). Another
meta-analysis of 37 programs also found that there was no impact on income after training
(Cho and Honorati, 2014).
There are some studies that reveal some positive effects of business training albeit under
certain conditions. For instance, there is a statistically significant positive effect on
entrepreneurs who had access to higher education (Cho and Honorati, 2014). In Chile, the
Micro-Enterprise Support Program (MESP) resulted in an increase in total income of US$70
which decreased to US$34 over the long term (Mart?nez et al., 2016). A study in Pakistan finds
that entrepreneurship training reduced the rate of business failure among men by 6.1% though
there was no effect on women (Gin? and Mansuri, 2014). Another study using data from seven
countries shows that standard training programs with focus on business practices are highly
correlated with differences in firm performance both in the cross section and panel data
(McKenzie and Woodruff, 2017).
The discovery that standard mass-delivered trainings are mostly ineffective led to the
experimentation of new approaches, for instance, an initiative in Togo providing ?personal
initiative? psychological training to small business owners is more effective in improving sales
and profitability than standard training programs (Campos et al., 2017). Anderson et al. (2018)
find that connecting small-scale entrepreneurs in Uganda with mentors across the world
through online meetings over Skype has little impact on business practices, highlighting the
importance of local knowledge or personal contact.
There are also a number of self-published reports from various organizations involved in
business training that show improvements after participation, for instance, Goldman Sachs?
10,000 small businesses program in the US where 68% of participants increased revenue after
six months (Sachs, 2016) and in the UK where one year after the program, average revenue
increased by 45% (Sachs, 2018). Technoserve has recently launched a program for training
micro-retailers in Kenya and the results of the program indicate that average revenue increased
by 44% and average profits increased by 56% (Waweru, 2019). A study done on female
entrepreneurs in Kenya who underwent business training shows that they increased revenues,
profits and the owners? well-being without any negative effects on non-treated businesses,
meaning that business growth in underdeveloped markets is possible without taking sales
away from non-treated businesses (McKenzie and Puerto, 2017).
While there is very limited evidence on the effectiveness of business training for SMEs,
the available evidence suggests that individualized consulting programs for bigger entities,
though largely more expensive, has significant effects on performance with costs being
recouped in less than a year (Bloom et al., 2012). ISBI?s unique approach of blending in-class
training with individual consulting sessions after they learn the core concepts significantly
reduces the traditionally large cost of individualized consulting services. There is an
increasing number of incubators and accelerators in lower-income countries, however, there
is limited evidence of their effectiveness (Woodruff, 2018). A majority of the studies focus
on either programs that provide technical skills through lectures in a classroom setting, or
mentoring projects or individualized consulting. ISBI provides services to its clients mainly
through lectures but also offers additional value-add on services of consulting, mentoring or
business plan development depending on the entrepreneur?s concrete needs and priorities.
Studying the differences between entrepreneurs? performance based on their choice of valueadded
will provide key insights into the most effective method of support for SGBs. The study
will also contribute significantly towards understanding more about which specific
components of accelerators are the most important in the context of the Kenyan SME sector.
Research shows that some interventions have different effects on males and females
(Woodruff, 2018). ISBI has approximately 50% male and 50% female alumni entrepreneurs
across various sectors, thereby providing the opportunity to discern differences in effects of
training on these businesses. This will greatly contribute to the much-needed body of
literature to assist in development of the most effective interventions for both female and male
owners.
Data and Methodology
Population and Sampling
The entire population under study includes 163 entrepreneurs who undertook the AEP from the
commencement of this study in May 2019. For the purpose of this study, it was determined that
32 of the entrepreneurs who had gone through the program not long before would be unable to
provide sufficient data at that point, leaving a net population of 131 entrepreneurs. According to
Krejcie and Morgan (1970), a population of 131 corresponds to a sample size of 98. From this
target sample size, there was a response rate of 80% (number of usable responses/target sample
size) (Fincham, 2008) which is significantly above the generally accepted minimum response rate
of 60% and in some cases even 50% (Draugalis et al., 2008).
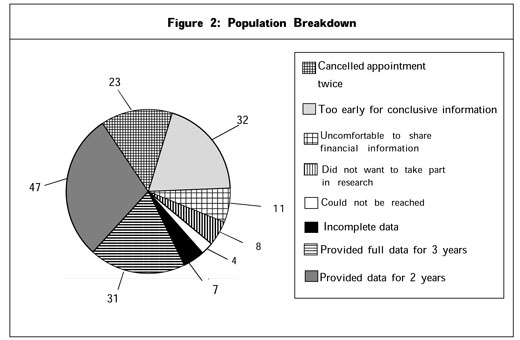
As shown in Figure 2, 47 participants were able to provide all the required data for 2 years.
31 participants were able to provide all the required data for 3 years. 32 participants took part
in the program during 2019 and it was determined that it was too early for conclusive
information at the time of data collection. 23 participants cancelled set appointments on more
than one occasion. 11 participants were uncomfortable sharing financial information.
8 participants refused to take part in the impact assessment. 7 participants responded to only
a part of the questionnaire. 4 participants could not be reached after calling on 5 separate
occasions as well as sending 2 emails with no response.
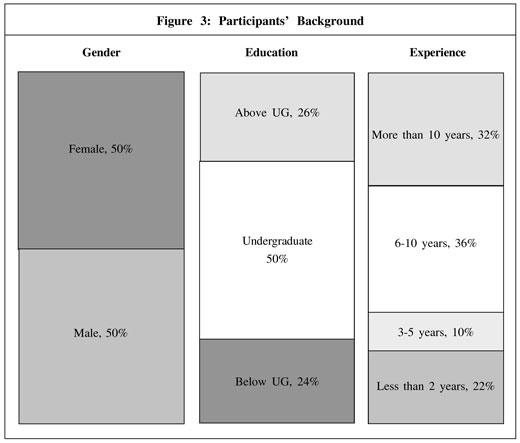
Complete datasets were obtained from 78 entrepreneurs: 43 were recorded at the clients? sites, 22 were recorded in ISBI premises and 13 were recorded over the phone. As shown in Figure 3, 50% of participants are female and 50% are male. 50% held an undergraduate degree, while 26% held a higher degree and 24% had a lower qualification than an undergraduate degree. Regarding how long the participants have been in the same business, 32% had over 10 years of experience, 36% had 6-10 years experience, 10% had 3-5 years experience and 22% had less than 2 years of experience. 61% were in the service sector, 24% in production and 15% in retail. In terms of industry, 19% were in professional services, 19% in building technologies, 13% in food and beverages, 12% in ICT, 9% in tourism and leisure, 8% in environmental technologies, 8% in education, and 12% in others. In terms of size 17% had revenues below US$20K, 10% had revenues between US$20-50K, 14% between US$50- 100K, 13% between US$100-200K, 22% between US$200-500K, 13% between US$500K to 1 mn and 12% had revenues greater than US$1 mn.
Data Collection
Since the data to be collected is of complex nature and can be interpreted in various ways,
it was necessary to train the data collectors beforehand in how to collect the data to ensure
accuracy and uniformity (Schindler, 2019). The data collected is both quantitative and qualitative.1 The quantitative data collected
relates to three distinct periods: the year before the program?12 months before the intake
date, the year during the program?12 months after intake date, and the year after the
program?13 to 24 months after intake date (where applicable).
The qualitative data was collected by asking participants to rate various characteristics of
the program and their experiences on a scale of 1-5 where 1 = No impact and 5 = Major
Transformation.
Data was collected through three main ways: interview in person at the clients? sites (in
55% cases), interview in person at ISBI offices in Strathmore University Business School (in
28% cases) and phone interview (in 17% cases).
Companies were categorized by industry sector according to the 10 clusters used by the
UK Department of Trade and Investment since 2001 (Midlands, 2012).
Data collected and used in evaluating impact include:
Employment
As employees are recognized as all people who work full-time for a concrete SGB and it
represents their main source of income, irrespective of legal status and formality of
employment. In some cases, especially in construction and agriculture sectors, the SGBs
employ quite a few seasonal workers. In such cases, the number of workers and working
months are annualized. For instance, six full-time workers engaged for four months are
reported as two full-time employees.
Revenue
Reported revenue represents total revenue from all business activities of an entrepreneur,
irrespective of formal, semi-formal or even completely informal nature of a concrete business
activity.
EBITDA (Earnings Before Interest, Tax, Depreciation and Amortization)
EBITDA is used as a measure of profitability increase because of lack of proper accounting
records and unfeasibility to collect precise data, especially on depreciation and total credit
costs. The change in EBITDA is used as the most relevant benchmark for measuring
increased market value of the SGBs (Damodaran, 2012). The measurement of this aspect is
very important as many SGBs strive for external equity capital, and the higher the initial
value of the enterprise, the stronger the entrepreneur?s negotiation position, i.e., they
sacrifice a smaller percentage of ownership for the same amount of investment.
EBITDA = Revenue ? COGS ? SGA
ECOD (Effective Cash at Owner?s Disposal)
For the purpose of this study we introduced a new metric: ECOD, i.e., Effective Cash at
Owner?s Disposal. It is similar to Owner?s Discretionary Cash Flow (ODCF), but net of credit
installments and effectively paid tax in the concrete year.
ECOD = EBITDA + Owners Salary + Owner?s Drawings ? Interest Expense ? Credit
Principal Repayment ? Tax Paid
ODCF (Kenton, 2018) is commonly used as one of the most important multiples for estimating
SME value in case of merger and/or acquisition of small businesses (Schmerler, 2016). Since ODCF
is used mainly for the purpose of valuation, current capital structure is irrelevant to the new owners.
Therefore, ODCF gives valuable information to the acquirers about the cash SMEs can generate,
irrespective of decision on how they are going to finance the acquired company.
The relevance of measuring the effective cash the owners have at their disposal is
extremely important for MSMEs in emerging countries being an indicator of their
sustainability (i.e., ability to generate cash from operation over and above credit and tax
obligations) as well as of the potential to sustainably grow their business (i.e., without
increasing leverage).
In Kenya, many MSMEs, especially the micro- and very small enterprises, rely on different
kinds of MFIs, less-regulated SACCOs and even informal Chamas. Moreover, even the
licensed banks often provide their financing products in a less transparent way as compared
to the common practice in developed countries. For instance, overdraft is typically given at
a fixed rate for three months, but the interest rate is applied flat to the highest amount exposed
during this period and not calculated per day pro rata. Such practices are combined with high
flat fees and other upfront charges, which (due to the short crediting period) have serious
effects on the actual costs of borrowing.
A majority of credits provided by MFIs and other, less regulated institutions are for very
short periods, typically up to one year. It makes the servicing monthly (or often weekly)
installments a real challenge and a serious threat to the MSME survival.
Due to all this and our primary interest lies not in enterprise valuation for the purpose of
sale, but in the increase of its sustainability, and we found that measuring ECOD is much more
suitable for our purpose. Additionally, by measuring changes in CROE (Cash Return on
Equity) we used changes in ECOD/Equity as significantly more informative in our case.
Finally, in our measurement of the Gross Value Added (GVA) we use the change in ECOD
in combination with the change in total amount of salaries paid.
After collection, the data was then entered into the database by the researchers. The data
was then prepared for analysis by ensuring that it was complete, accurate and appropriately
coded (Schindler, 2019).
Data Analysis
The report seeks to estimate the GVA to the participants? businesses using methodology
borrowed from similar impact assessments carried out by Aston Business School (Butler and
Wilson, 2015) and Advantage West Midlands (Midlands, 2012).
This study measures GVA using three of the recognized approaches which center on
business (turnover), employment (change in number of employees), and business (salaries and
profits). The above approaches were calculated for the sample size and then extrapolated over
the entire population in order to estimate the total impact of the program.
Results
Business (Turnover)
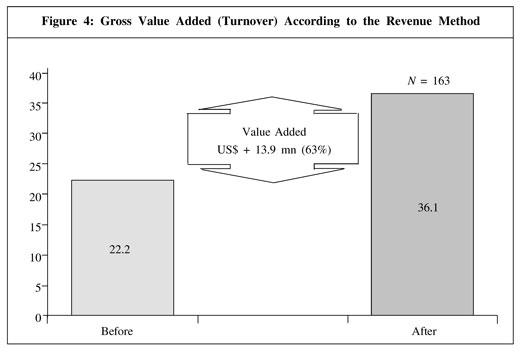
After participation in the program, average revenue increased by 63% (US$285,000) from
US$437,000 to US$733,000. There was a total increase in revenue across all participants by
US$48.3 mn from US$73.9 to 120.3 mn, thereby contributing to the growth of the economy.
This growth was fueled by 71% of participants who increased their revenue, while 25%
reduced their revenue and 4% did not experience any change. The increase in revenue among
the smaller-sized entrepreneurs who fall within the first quartile (Q1), was 56% which is similar
to the average revenue increase of 63%. This implies that the average is not skewed upwards
by some big companies and growth is similar across all sizes of businesses. This average
increase in revenue one year after the intake is roughly 1.5 times higher than similar, fully
sponsored programs in developed economies such as the UK (Sachs, 2018). Furthermore, when
looking at growth, 40% of participants were able to grow into the next category, testifying
to the effectiveness of the program.
The GVA is US$13.9 mn as shown in the Figure 4 and is calculated as 30% of the total
increase in revenue for all participants translating to a 63% increase (Midlands, 2012; and
Butler and Wilson, 2015).
Job Creation
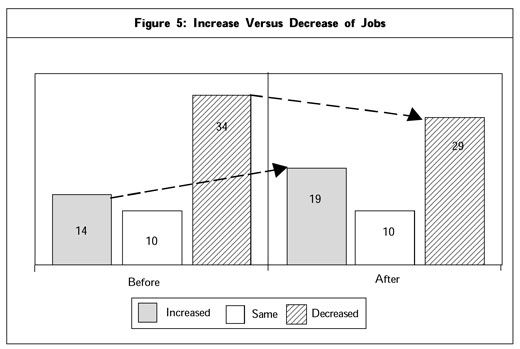
After participation in the program, there were on average 3 new jobs created per SGB,
especially among the smaller businesses. As shown in Figure 5, 42 SGBs (54%) with 14
employees on average increased their staff by 5, creating 235 jobs. There was no reported
difference in the number of employees for 22 SGBs (28%). There was also a reduction in the
number of employees, particularly in the larger companies that were overstaffed and
underwent optimization processes. 14 SGBs (18%) with 34 employees on average reduced
their staff by 5, i.e., 64 in total. In combination, these two effects (growth of the smaller and
optimization of the larger SGBs) resulted in a net creation of 2.2 jobs per SGB which translates
to 357 net new jobs.
Business (Salaries and Profits)
Within a year of participating in the program, average EBITDA increased by 106%
(US$72,000) from US$67,000 to US$139,000. There was a total increase in EBITDA by
US$12 mn from US$11 mn to US$23 mn. This growth was fuelled by 81% of participants who
increased their EBITDA, while 13% reduced their EBITDA and 6% did not experience any
change. Increase in EBITDA after going through the program is remarkably strong in the lower
segment (Q1) with EBITDA increasing by 320% (US$14,000). Specifically of interest is the
fact that 8% of businesses reduced their turnover by 20% on average, but tripled their EBITDA
(increased by 193%), which is one of the AEP?s key messages: ?optimization before growth?.
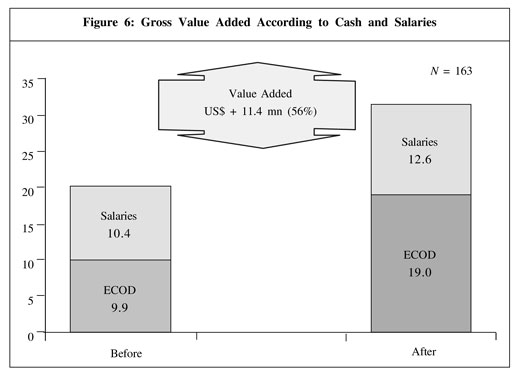
Within 1 year of participating in the program, average ECOD increased by 92%
(US$56,000) from US$60,000 to US$116,000. There was total increase in ECOD by
US$9.1 mn from US$9.9 mn to US$19 mn as shown in Figure 6. This growth was fuelled by 81% of participants who increased their ECOD, while 17% reduced ECOD and 2% did not
experience any change. The average increase in ECOD is equally strong in the lower segment
with increase in ECOD of 94% (US$10,000).
Net employment increased by 357 (491 gross) and in combination with average salary
increase of +US$287 per employee per annum amounts to US$2.26 mn increase in salaries.
Total amount of salaries and profits changed from US$20.22 mn to 31.57 mn, i.e., increase
of US$11.35 mn.
Statistical Significance
Two-sample t-tests were carried out on the samples for each category of revenue, EBITDA,
ECOD and employment to determine the statistical significance of the changes attributed to
going through the program on these variables, at 5% significant level. The results reveal that
the changes in the businesses can indeed be attributed to their participation in the program
as shown in Table 1.
Client Satisfaction
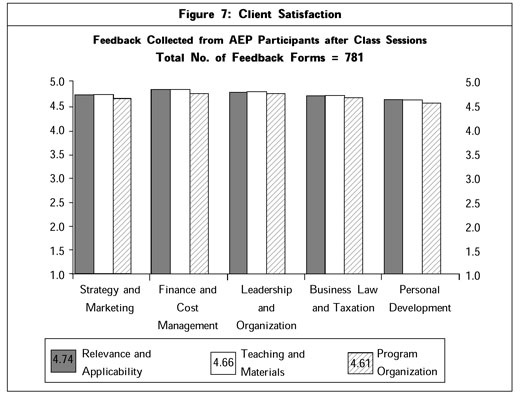
After each class session, participants fill in a feedback form where they rate the session
and provide suggestions for improvement. The ratings are made on a scale of 1 to 5, where
the answers are summarized in three thematic groups and represented as average for each
group:
- Relevance and applicability, ranging from (1) Not at all ? to (5) Very much.
- Teaching method and provided materials, ranging from (1) Poor ? to (5) Excellent
- Program organization, venue, etc. in the range from (1) Poor ? to (5) Excellent
Continuous and meticulous study of clients? feedbacks for each subject and lecturer is the
only way to keep quality at the desired level and to improve instead to degrade the
effectiveness of the program with the time.
The soaring reviews received from AEP participants of over 90% rating across all modules
and aspects, shown in Figure 7, testify to the quality of the program and the value that they
derive from it.
Personal Development
Over 80% of alumni reported significant positive impact on their leadership confidence and
capability, what translates into concrete organizational improvements. About 75% of
participants reported improvements in delegation of duties, thus freeing up time for strategic
thinking and planning.
Over 75% of participants reported major transformation or significant improvement in their
understanding of finance, especially in relation to their business. However, this improved
understanding of finance by the entrepreneurs is not matched by an equivalent improvement
in record keeping and cost optimization where only about half of the participants reported
major transformation or significant improvement.
Discussion
Investor Desirability
Analysis of the data collected shows that Return on Assets as a measurement of management
efficiency increased by 81% within a year of participating in the program [Due to lack of
precise information about interest costs explained above, (EBITDA/Assets) is used as much
more reliable metrics for comparison over time than typically calculated (Net Income/Assets)]
This can be attributed to participants? better understanding of finance and how thereby to
better utilize the assets at their disposal to generate greater returns.
Cash return on equity (ECOD/Equity) as a measure of SGB attractiveness for investors
went up by 62%. As a result of the participants? increased understanding and awareness
regarding their business, they are able to generate greater returns on their investments
through a combination of deleveraging, streamlining operations and precisely focused
investing.
These significantly higher ratios make SGBs more attractive to potential investors as it is
an indication of the effectiveness of the management as well as the ability of the company
to generate cash. This makes it easier for the SGB owners to raise capital, if they decide to
seek investment for further growth and expansion.
Risk Reduction
Debt coverage ratio as an indication of SGB?s ability to service its credit obligations
increased by 55%. This is brought about by the improved profitability and cash generation
of the firm and represents one of the most important achievements of the AEP: reduction
of risk of falling into illiquidity (most common bankruptcy cause, especially among very
small SGBs). Furthermore, lending institutions are more willing to extend additional credit
to these SGBs.
These findings are in line with earlier studies carried out by Karlan and Valdivia (2006),
who found that through entrepreneur training, microfinance institutions also had direct
benefits in terms of higher repayment and client retention rates.
Debt/Equity (D/E) ratio, as a measure of financial risk SGBs are exposed to, was reduced
by 19% within one year. This is also an extremely important achievement of AEP as it makes
SGBs much more robust against changes in their very volatile market conditions?resulting
in significantly reduced likelihood of falling into insolvency.
Insights
Gender
We have not identified any statistically relevant differences between men- and women-owned
SGBs. This implies that both men and women benefit similarly from the training provided.
Experience
We attribute the differences based on the entrepreneurial experience much more to the
difference in the SGB size than to the actual owner?s experience. Profit has more than doubled
in each segment, but the profit drivers are different:
- Improvement in SGBs with owners having fewer than 10 years of experience (actually smaller SGBs with revenue of US$300K on average) was driven mainly by increased turnover (87%) and less by profit-margin increase (15%).
- On the contrary, in SGBs with more experienced owners (in fact, bigger SGBs with revenue of US$779K on average) the change was achieved by the turnover increase of 43% (half the rate of smaller SGBs) and profit-margin increase of 34% (double the rate compared to smaller SGBs). Education
- The participants with a degree above undergraduate ? tripled EBITDA (+221%)
- The participants with undergraduate degree ? doubled EBITDA (+108%)
- The participants with educational level below undergraduate ? increased EBITDA ?only? by half (+49%)
Differences based on educational background support the assumption that better educated participants benefit much more from the program:
Cost Recovery
A majority of participants recovered the cost of the program already during the program itself
through increased profits and operations, with 80% recovering their costs within three months.
Only 10% of participants required more than 6 months to recover their costs. Next to ensuring
sustainability of entrepreneurship programs, this finding reinforces ISBI?s founding
presumption that such training must be perceived by MSMEs not as a personal owner?s
expense, but as investment into their business and as such must bear return.
Comparative Impact
Comparing the performance of the AEP alumni to the performance of participants in other
programs as well as the larger economy as a whole helps to put things into perspective. The
Global Accelerator Learning Initiative (GALI), which draws data from the Entrepreneur
Database Program at Emory University, provides a benchmark using 12 acceleration programs
in developing countries with the focus on creating impact on for-profit micro and small
enterprises across all sectors (ANDE, 2019), similarly to AEP. This benchmark compares the
78 AEP alumni to 86 accelerated ventures with the following results:
Conclusion
Leadership affects the potential of the entrepreneur. There are also a number of practical issues
related to leadership that affect entrepreneurship and the success of the entrepreneur.
The entrepreneur naturally and essentially becomes a leader the moment he sets out to be
an entrepreneur.
The impact of leadership on entrepreneurship is strongly dependent on the definition of
leadership and the measure used to assess leadership.
There are strong similarities between entrepreneurs and leaders. Entrepreneurs and leaders
have a number of skills and competencies in common. When the entrepreneur develops and
matures, he is naturally and inadvertently developing leadership skills and competencies.
Conversely, the entrepreneur can further develop and can accelerate his development by
developing leadership skills and competencies (Lord and Hall, 2005).
Strategic leadership forms an important aspect of entrepreneurship. Although not limited
to them, novice entrepreneurs in particular can further develop in this area.
A number of factors like culture and the market impair the power and influence of the
entrepreneur. It is the entrepreneur as strong leader that is able to rise above this. Leadership as a concept is not always fully understood by entrepreneurs, and it impacts the performance
and success of entrepreneurs. Entrepreneurs do not always associate strategic leadership and
exerting influence over contexts with leadership. Entrepreneurs can further develop in terms
of leadership skill and competency. Recognition of leadership and fear of failure are
prominent factors that impair leadership, and consequently entrepreneurship success.
Leadership is not really recognized and regarded in social and other contexts.
Innovation can be seen as exerting influence over a context, etc. in order to shape it.
Leadership similarly impacts the potential of the (entrepreneur as) innovator. The leader and
innovator equally share a number of common skills and competencies.
Leadership and leadership process form part of innovation method and thereby affect the
sustainability of innovation and innovativeness. Leadership equally affects the effectiveness
and accuracy of innovation, and leadership helps to manage and direct the uncertainty
associated with the innovation process. When considering this, it is possible to talk of and
refer to innovation leadership.
Limitations:
- For practical reasons, only entrepreneurs from South Africa were interviewed. This could skew the results in that entrepreneurs from other countries, especially first world countries, might have had different perceptions.
- According to Willig and Stainton-Rogers (2008, p. 158), "Qualitative research does not always provide the researcher with certainty."
- Since the researcher becomes immersed in the research, "alternative interpretations are always possible" (p. 158).
- One of the selection criteria suggested that entrepreneurs had to have a business for a minimum of three years. We assumed that three years was an adequate period to develop leadership perceptions. Scope for Future Studies: Future studies can further examine the following: The practical impact of leadership on entrepreneurship can be further examined to a greater depth. An intervention study can train and develop the leadership skills and competencies of a group of entrepreneurs, and the impact on their entrepreneurial thought and output, and their innovativeness can be compared to that of a group of entrepreneurs who did not receive such training and development.
- The relative success of a leadership training and development program for entrepreneurs can also be monitored.
- Strategic leadership in the context of entrepreneurship, and the strategic leadership skill and competency of entrepreneurs.
- The recognition and regard of leadership in social and other contexts: whether leadership is truly celebrated and regarded in social and other contexts, and the potential reasons why not.
- An in-depth comparison of leaders and entrepreneurs to highlight both the similarities and differences.
- The comprehension of leadership by entrepreneurs.
- The ways in which leaders shape and influence contexts, and the ability of leaders to shape and influence contexts
References
- Avolio B J and Gardner W L (2005), Authentic Leadership Development: Getting to the Root of Positive Forms of Leadership, pp. 315-338.
- Barriball K L and While A (1994), "Collecting Data Using a Semi-Structured Interview: A Discussion Paper", Journal of Advanced Nursing, Vol. 19, No. 2, pp. 328-335. Retrieved on July 2018.
- Bass B M, Avolio B J, Jung D I and Berson Y (2003), "Predicting Unit Performance by Assessing Transformational and Transactional Leadership", Journal of Applied Psychology, Vol. 88, No. 2, pp. 207-218.
- Bell J (2010), Doing Your Research Project: A Guide for First-Time Researchers in Education, Health and Social Science, 5th Edition, Open University Press.
- Bolden R (2016), Leadership, Management and Organisational Development, Routledge.
- Braun V, Clark V and Terry G (2014), "Thematic Analysis", in P Rohleder and A Lyons (Eds.), Qualitative Research in Clinical and Health Psychology, Palgrave MacMillan, Basingstoke.
- Collins D B and Holton III E F (2004), "The Effectiveness of Managerial Leadership Development Programs: A Metaanalysis of Studies from 1982 to 2001", Human Resource Development Quarterly, Vol. 15, No. 2, pp. 217-248.
- Darlington Y and Scott D (2002), Qualitative Research in Practice: Stories from the Field, Open University Press, Buckingham.
- Dawson T L (2008), "Metacognition and Learning in Adulthood", Prepared in Response to Tasking from ODNI/CHCO/IC Leadership Development Office, Developmental Testing Service, LLC.
- Day D V (2000), "Leadership Development: A Review in Context", The Leadership Quarterly, Vol. 11, No. 4, pp. 581-613.
- Day D V, Fleenor J W, Atwater L E et al. (2014), "Advances in Leader and Leadership Development: A Review of 25 Years of Research and Theory", The Leadership Quarterly, Vol. 25, No. 1, pp. 63-82.
- Densten I L and Gray J H (2001), "Leadership Development and Reflection: What is the Connection?", International Journal of Educational Management, Vol. 15, No. 3, pp. 119-124.
- Dugan J P (2006), "Explorations Using the Social Change Model: Leadership Development Among College Men and Women", Journal of College Student Development, Vol. 47, No. 2, pp. 217-225.
- Golafshani N (2003), "Understanding Reliability and Validity in Qualitative Research", The Qualitative Report, Vol. 8, No. 4, pp. 597-606.
- Hogan R, Curphy G J and Hogan J (1994), "What We Know About Leadership: Effectiveness and Personality", American Psychologist, Vol. 49, No. 6, pp. 493-504.
- Komives S R and Dugan J P (2007), "Developing Leadership Capacity in College Students", National Clearinghouse for Leadership Programs, College Park, MD.
- Komives S R, Lucas N and McMahon T R (2009), Exploring Leadership: For College Students Who Want to Make a Difference, John Wiley & Sons.
- Komives S R, Owen J E, Longerbeam S D et al. (2005), "Developing a Leadership Identity: A Grounded Theory", Journal of College Student Development, Vol. 46, No. 6, pp. 593-611.
- Kothari C (2004), Research Methodology, Methods and Techniques, New Age International (P) Limited, Publishers, Jaipur, India.
- Longhurst R (2003), "Semi-Structured Interviews and Focus Groups", Key Methods in Geography.
- Lord R G and Hall R J (2005), "Identity, Deep Structure and the Development of Leadership Skill", The Leadership Quarterly, Vol. 16, No. 4, pp. 591-615.
- Mayer J D and Geher G (1996), "Emotional Intelligence and the Identification of Emotion", Intelligence, Vol. 22, No. 2, pp. 89-113.
- McCleskey J A (2014), "Situational, Transformational, and Transactional Leadership and Leadership Development", Journal of Business Studies Quarterly, Vol. 5, No. 4, pp. 117-130.
- McDermott R (2011), "Internal and External Validity", Cambridge Handbook of Experimental Political Science, Cambridge University Press, pp. 27-40.
- Mumford M D, Friedrich T L, Caughron J J and Byrne C L (2007), "Leader Cognition in Real-World Settings: How do Leaders Think About Crises?", The Leadership Quarterly, Vol. 18, No. 6, pp. 515-543.
- Odom S F, Boyd B L and Williams J (2012), "Impact of Personal Growth Projects on Leadership Identity Development", Journal of Leadership Education, Vol. 11, No. 1, pp. 49-63.
- Pearce C L (2007), "The Future of Leadership Development: The Importance of Identity, Multi-Level Approaches, Self-Leadership, Physical Fitness, Shared Leadership, Networking, Creativity, Emotions, Spirituality and On-Boarding Processes", Human Resource Management Review, Vol. 17, No. 4, pp. 355-359.
- Ready D A and Conger J A (2003), "Why Leadership-Development Efforts Fail", MITs Loan Management Review, Vol. 44, No. 3, pp. 83-88.
- Shamir B and Eilam G (2005), "What's your Story?", A Life-Stories Approach to Authentic Leadership Development, Vol. 16, No. 3, pp. 395-417.
- Uhl-Bien M, Marion R and McKelvey B (2007), "Complexity Leadership Theory: Shifting Leadership from the Industrial Age to the Knowledge Era", The Leadership Quarterly, Vol. 18, No. 4, pp. 298-263.
- Vroom V H and Jago A G (2007), "The Role of the Situation in Leadership", American Psychologist, Vol. 62, No. 1, pp. 17-24.
- Willig C and Stainton-Rogers W (2008), Qualitative Research in Psychology, Open University Press, Google Scholar, Maidenhead.
- Zohar D (2005), "Spiritually Intelligent Leadership", Leader to Leader, Vol. 2005, No. 38, pp. 45-51.